U.S. stocks in second longest rally since 1936: where to from here?
One of the most impressive runs of all time
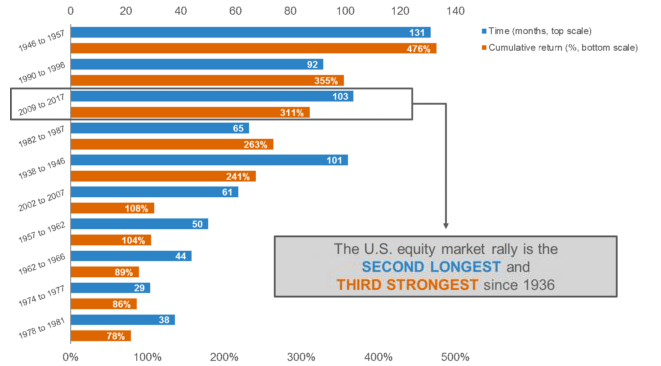
The data is clear: At 103 months in length and boasting a cumulative return of 311% as of September 30, 2017, the current U.S. bull market (S&P500® Index) is the second longest and third strongest expansion since 1936, making it one of the most impressive runs in modern history.
As of September 2017. Source: Morningstar.
S&P 500® Index – Quarterly Returns 04/01/1936 to 11/30/1987; Monthly Returns 31/12/1987 to 30/9/2017.
Expansions end after surpassing previously reached highs of the S&P 500 and a drawdown occurs of 10% or more.
Index returns represent past performance, are not a guarantee of future performance, and are not indicative of any specific investment. Indexes are unmanaged and cannot be invested in directly.
These accolades beg the question:
What can investors expect going forward?
Impressive as it is, the current rally still has some ground to cover if it intends to match the longest and strongest expansion of 1946 to 1957, which lasted a whopping 131 months and had a cumulative return of 476%. However, that historical case is likely best treated as an outlier rather than as a measuring stick for how much steam today’s market run may still have.
Instead, valuations—specifically the Cyclically Adjusted Price-to-Earnings Ratio, or CAPE for short—offer a better assessment of the market’s remaining upside potential, in our view. Past bull markets can also be a guide. Let’s take each in turn.
What are valuations suggesting?
CAPE can be a helpful guide for measuring how cheap or expensive current stock market prices are relative to the amount of earnings they are generating. More importantly, examining the equity market’s historical levels of CAPE and subsequent returns can offer valuable lessons for potential expectations today.
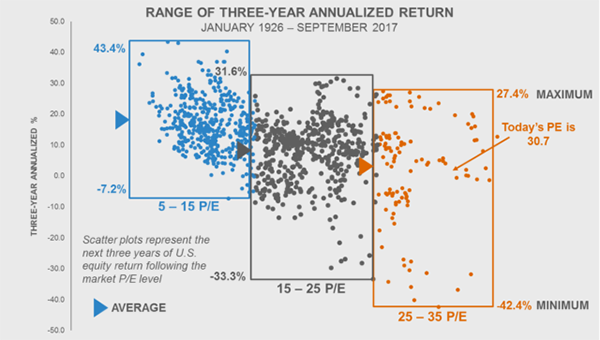
The chart below illustrates this relationship between CAPE and subsequent three-year market returns going back to 1926. It divides the observed CAPE levels into three groups:
- “Cheap” Valuations (blue box): Market CAPE levels of 5–15
- “Average” Valuations (grey box): Market CAPE levels of 15–25
- “Expensive” Valuations (orange box): Market CAPE levels of 25–35
Yale Professor Robert Shiller calculates a Cyclically Adjusted P/E Ratio based on stock price divided by prior 10-year earnings. The stocks included are those of large publicly held companies that trade on either of the two largest American stock market exchanges: the New York Stock Exchange and the NASDAQ. The stock market returns represent past performance, are not a guarantee of future performance, and are not indicative of any specific investment.
Index returns represent past performance, are not a guarantee of future performance, and are not indicative of any specific investment. Indexes are unmanaged and cannot be invested in directly.
What can we learn from these different valuation levels?
- Cheaper valuations historically have been followed by higher average equity returns for three years, with a less negative minimum return and more positive maximum return.
- Expensive valuations have tended to yield lower subsequent average equity returns for three years with a more negative minimum return and less positive maximum return.
- While “cheap” and “average” market valuations historically have had a high probability of delivering positive returns over the following three years, the range of returns in the “expensive” scenario has been much wider—and hence more uncertain—compared to other market environments.
As of September 30, 2017, the U.S. equity market has a CAPE of 30.7—putting it squarely in the “expensive” group.
It appears history is suggesting it may be time to reduce return expectations relative to the level many investors have grown accustomed to since the end of the Global Financial Crisis.
What lessons do past bull markets suggest?
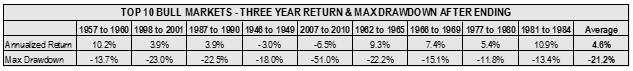
How did the past bull markets listed in the first exhibit of this post fair over the following three years after coming to an end? Not surprisingly, the results aren’t too attractive. As you can see in the table below, the average return over the next three years was less than 5.0% and the average maximum drawdown was approximately -21.0%.
As of September 2017. Source: Morningstar.
S&P 500® Index – Quarterly Returns 01/04/1936 to 30/11/1987; Monthly Returns 31/12/1987 to 30/9/2017.
Expansions end after surpassing previously reached highs of the S&P 500 and a drawdown occurs of 10% or more.
Index returns represent past performance, are not a guarantee of future performance, and are not indicative of any specific investment. Indexes are unmanaged and cannot be invested in directly.
The bottom line:
Coming in as the second longest and third strongest, the current U.S. equity market rally ranks as one of the most impressive bull markets since 1936. While many investors undoubtedly have enjoyed the eight-year run, history suggests now may be a good time to diversify sources of return within investment portfolios. Russell Investments believes a globally diversified, multi-asset approach that can respond and adapt quickly to changing market environments has the potential to help navigate the subsequent vagaries of expensive markets.