Where might you find returns in 2019 Consider private markets
How much of your portfolio is allocated to private markets? How big is the total opportunity set? Here are a couple of stats to get your attention:
- As of Q4 2018, there were nearly 200,000 middle-market companies just in the U.S., with $10 million to $1 billion in annual revenue1 , yet there were less than 3,600 publicly traded companies in the U.S. at the end of last year.2
- Considered alone, these privately held middle-market companies would represent the third largest economy globally, trumping the economies of Japan and Germany.
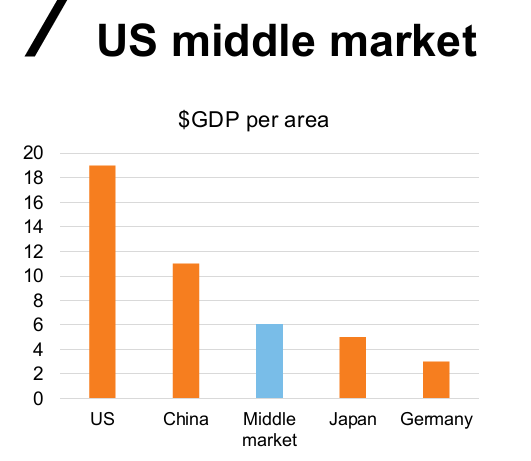
Source: Russell Investments, National Center for the Middle Market, 4Q 2018, Dun and Bradstreet Middle Market Index.
Private markets don't just represent an economic force. They represent an equally potentially significant investment opportunity, with all the potential risks and upsides that come with such scale. When it comes to upside potential, we believe the return and volatility profiles from this sector are increasingly attractive, particularly in the current environment. We're not alone. That potential has attracted a significant amount of capital to the space, with good reason.
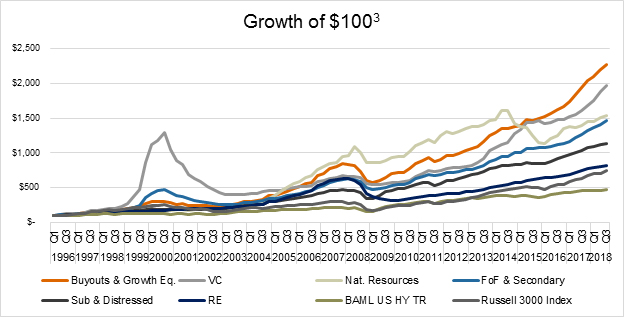
VC: Venture Capital. RE: Real Estate. BAML US HY TR: BAML U.S. High Yield Total Return Index. FoF & Secondary: FOF (Venture and Private Equity) and Secondary Funds.
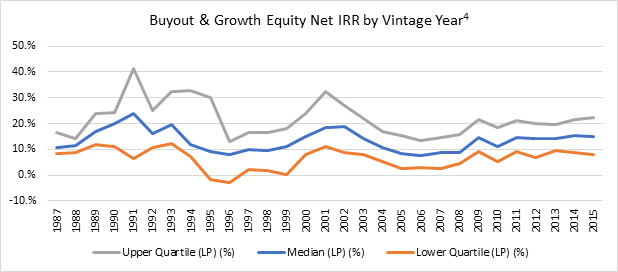
And when it comes to risk, it's clear that navigating this space is no simple task. Take private capital as an example: The dispersion of returns—from top to bottom quartile—continues to be wide. For example, in 2015, the top quartile of private capital outperformed the bottom by nearly three times.3 We believe this dispersion underlines the importance of working with skilled managers who can navigate the risk landscape.
Despite the navigational challenges, growth in this sector continues. In the last few years, we've seen some of the highest commitments to private markets ever, with over $4.2 trillion raised across private markets from 2014 through the end of 2018.5 At the same time, private-markets dry powder numbers (capital committed to funds that has yet to be deployed in opportunities) have more than doubled, from $1.0 trillion in 2010 to $2.2 trillion6 in 2018. Total private markets AUM—the combination of unrealised values AND dry powder—totaled some $5.8 trillion, as of June 2018.7
The illiquidity premium
So where might investors potentially look for returns in 2019? At Russell Investments, we firmly believe that private markets may represent a salve to the low-return environment of public markets. Despite increases in capital flows to the space, a variety of opportunities persist, given the structural advantages that closed-end, long-term, illiquid structures allow skilled investment managers to pursue. Possibilities remain in all sub-asset classes, including:
- Buyouts
- Venture
- Growth-equity
- Impact
- Real estate
- Infrastructure
- Natural resources
- Private debt/credit
- Distressed and Special Situations
- Other opportunistic strategies
Private markets obviously come with liquidity limitations, but by embracing the long-term aspects of these illiquid assets, we believe long-term investors can find significant advantages. Access to private companies, assets and related strategies are most commonly delivered through fund structures of 10 +/- years. Critics may lament this inherent illiquidity, but this feature has served as a strength, as longer-term investments have historically outperformed broader public markets. The illiquidity premium which investors rightfully expect varies by asset class. Private equity, for example, has historically delivered returns of 400-600 basis points over public equity markets.8
It may not just be the returns that are larger. The overall prospects appears to be growing as well, with the broad opportunity set within private markets growing relative to the number of public companies. According to Dow Jones VentureSource as of Q4 2018, in the U.S., since 1992, there has been an upward trend in venture-capital-backed company formations, set against a downward trend in the number of domestic listed companies.
A global view on private markets
The complexities of private-markets investing are unavoidable. And they become more apparent when the segment is viewed globally. From our own institutional-investor clients, we've seen interest levels remain strong in middle-market buyouts in North America and Europe, in industry-specific strategies and in venture capital (mainly in the U.S., with increasing interest in Asia increasing and a renewed interest in Europe). On the other hand, we've seen interest waning for private market opportunities in emerging markets, and increased caution toward the UK and the eurozone given the uncertainty surrounding the impact of Brexit.
This global inconsistency shows that watchpoints remain. Private-market investing continues to demand expertise, increased awareness, scrutiny, underwriting and access to opportunities. We're seeing increased complexities in capital structures, industry sensitivities, regulatory changes and geopolitical events. We're also paying special attention to pricing levels, as purchase-price multiples have exceeded pre-global-financial-crisis levels. Have private markets reached another peak of a market cycle? With such a nuanced global market, the answer is more complex than a simple yes or no, so we continue to invest significant research and due diligence into such issues, segment by segment, region by region, strategy by strategy, and of course, manager by manager.
The growth of private credit
One specific area of growth is private credit. Consider this trend: In 1994, foreign and domestic banks' share of the leveraged loan market was 71%. By 2017, that number had dropped to only 9%, with the other 91% covered by non-bank companies and funds.9 In other words, in the last 24 years, private credit grew from 29% to 91% of the leveraged loan market. We believe this may represent a significant investment opportunity that may help investors close the gap in their long-term investment goals.
Yield-oriented investments
For institutional clients looking for yield-oriented investments, we've seen greater interest in private markets, particularly in private debt and related opportunities, both on the corporate as well as the asset-backed side. We believe the U.S. remains the deepest market for private debt, followed by Europe, and the number of institutional-quality private-debt managers in Asia continues to increase. On the asset-backed side, we believe real estate offers the deepest potential opportunity set, with a number of open-ended vehicles available to investors, unlike most other areas of private markets.
An increase in market maturity
In some ways, private markets are actually getting easier to invest in. Enough efficiency is coming to private markets that secondary funds and acquisitions may help investors accelerate their exposure, reduce their fees and increase liquidity. We see private equity as the most mature segment of private markets, with real assets strategies—mainly real estate, infrastructure and energy—becoming increasingly efficient as well. The use of leverage at both the fund level and transaction level has increased, so it's important for investors to understand the drivers and risks of expected returns as they evaluate these opportunities.
A best-practice approach to private-markets investing
Despite that growing efficiency and maturity, investing in private markets is unavoidably complex, so it's good news that a multi-manager approach to private markets—ours included—continues to specialise and mature as well. We believe the best-suited firms will provide their investor clients with the following capabilities:
- An open architecture approach to find the best net returns, on a risk-adjusted basis. This approach should cast a wide enough net to include multi-managers, secondary funds and primary funds, as well as transactional investments such as secondary acquisitions and co-investments.
- Relative value assessments in an effort to target the best-positioned opportunities—not in theory, but within the specifics of the current real-world market environment.
- The ability to identify the best available managers and funds. Clearly not every private market opportunity is worth the risk. A firm should have the research depth and discipline to find the best opportunities, while refraining from consummating new commitments if they don't believe the opportunity set justifies the activity.
- Appropriate underwriting. Attractive opportunities remain in all segments. But with so much competition for deals, low-interest rates and thousands of funds seeking to raise capital, it's more important than ever to appropriately underwrite the manager, strategy and market in an effort to maintain outsized returns.
The bottom line
When it comes to private markets, we believe the opportunity is substantial. We believe the pace of growth in private markets will unavoidably impact the way investors build their portfolios in coming years. And we believe long-term investors will carefully choose the firms they work with in this area, to help ensure they find the best opportunities while navigating the risks of this complex, global, ever-changing sector.
Disclosures
These views are subject to change at any time based upon market or other conditions and are current as of the date at the top of the page.
Investing involves risk and principal loss is possible.
Past performance does not guarantee future performance.
Forecasting represents predictions of market prices and/or volume patterns utilizing varying analytical data. It is not representative of a projection of the stock market, or of any specific investment.
This material is not an offer, solicitation or recommendation to purchase any security. Nothing contained in this material is intended to constitute legal, tax, securities or investment advice, nor an opinion regarding the appropriateness of any investment, nor a solicitation of any type.
The general information contained in this publication should not be acted upon without obtaining specific legal, tax and investment advice from a licensed professional. The information, analysis and opinions expressed herein are for general information only and are not intended to provide specific advice or recommendations for any individual entity.
Please remember that all investments carry some level of risk. Although steps can be taken to help reduce risk it cannot be completely removed. They do no not typically grow at an even rate of return and may experience negative growth. As with any type of portfolio structuring, attempting to reduce risk and increase return could, at certain times, unintentionally reduce returns.
Investments that are allocated across multiple types of securities may be exposed to a variety of risks based on the asset classes, investment styles, market sectors, and size of companies preferred by the investment managers. Investors should consider how the combined risks impact their total investment portfolio and understand that different risks can lead to varying financial consequences, including loss of principal. Please see a prospectus for further details.
Indexes are unmanaged and cannot be invested in directly.
The Russell 3000® Total Market Index measures the performance of the largest 3,000 U.S. companies representing approximately 98% of the investable U.S. equity market.
The Bank of America Merrill Lynch US High Yield Total Return Index is an unmanaged index that tracks the performance of below investment grade U.S. dollar-denominated corporate bonds publicly issued in the U.S. domestic market.
Russell Investments' ownership is composed of a majority stake held by funds managed by TA Associates with minority stakes held by funds managed by Reverence Capital Partners and Russell Investments' management.
Frank Russell Company is the owner of the Russell trademarks contained in this material and all trademark rights related to the Russell trademarks, which the members of the Russell Investments group of companies are permitted to use under license from Frank Russell Company. The members of the Russell Investments group of companies are not affiliated in any manner with Frank Russell Company or any entity operating under the "FTSE RUSSELL" brand.
Copyright © Russell Investments Group LLC 2018. All rights reserved.
This material is proprietary and may not be reproduced, transferred, or distributed in any form without prior written permission from Russell Investments. It is delivered on an “as is” basis without warranty.
1 National Center for the Middle Market, 4Q 2018 Middle Market Indicator
2 Wilshire, Wilshire 5000 Total market Index Fact Sheet, December 31, 2018.
3 Cambridge Associates/Thomson Reuters and FRED, Based on a growth of $100 calculation re-based at Q1 1996, using quarterly returns from Thomson Reuters for Private Equity, Venture Capital, Natural Resources, FoF’s and Secondaries, Subordinated and Distressed, and Real Estate, and the following indexes accessed through FRED to represent each asset class: Russell 3000 ® Total Market Index and Bank of America Merrill Lynch US High Yield Total Return Index. Index returns represent past performance, are not a guarantee of future performance, and are not indicative of any specific investment. Indexes are unmanaged and cannot be invested in directly.
4 Cambridge Associates/Thomson Reuters, Buyout & Growth Equity Benchmark – Q3 2018
5 Preqin, Private Capital Fundraising Report, Q4 2018.
6 Preqin, Private Capital Fundraising Report, Q4 2018.
7 Preqin, PreqinPro Online Database– accessed Feb. 2019
8 Pitchbook, PB Benchmarks: 1Q 2018
9 Ares Direct Lending white paper / S&P LCD, "S&P Leveraged Lending Review" – Q4 2017