Cargo ships

How to make sense of Trump's 'tough love' tariffs

2025-04-03

Paul Eitelman, CFA

Paul Eitelman, CFA

Global Chief Investment Strategist


Updated Thursday, April 3 at 8 a.m. Pacific time

U.S. stocks underperformed in the first quarter of 2025, hit by a double whammy from intensifying policy uncertainty and a U-turn in select mega cap stocks. Into this volatile backdrop, April 2—President Trump’s so-called Liberation Day—was circled on investors’ calendars as a catalyst.

Tariff talk

Yesterday’s announcement from the Rose Garden in Washington, D.C., marked another bold policy step, charging large reciprocal tariffs against many of the United States’ largest trading partners. For example, the policy includes:

  • A new 10% base tariff on most trading partners, effective April 5
  • A ramp-up a few days later to match half of the tariff and non-tariff barriers that countries impose on the U.S.

We estimate the average effective tariff rate could increase by almost 14%—a historically large increase in trade duties.

Two higher level observations are important here. First, the reciprocal tariffs leave room for the duties to get negotiated away. Case-in-point: Some very large exporters like Vietnam have already said that they will cut all tariffs on U.S. products. Second, the exemptions separate the reciprocal policy from Trump’s sector-level tariffs like steel, aluminum, and automobiles. This suggests to us that those sector-level tariffs are likely to be more permanent.

"We estimate the average effective U.S. tariff rate could increase by almost 14%—a historically large increase in trade duties."

Paul Eitelman, CFA

Global Chief Investment Strategist

Growth hit

The administration had already pushed harder than expected on trade policy with tariffs on imports from China, Canada, Mexico, steel, aluminum, and automobiles & parts. While the policies could support domestic manufacturing over the longer-term, we estimated these measures were likely to act as a drag on real GDP growth of 0.5-0.75% and a boost to core PCE inflation of 0.75%.

Today’s reciprocal tariffs could dent real GDP growth by another 0.75% and lift core PCE inflation by an additional 1%. That would likely leave the U.S. growth outlook at 1% or less for 2025 and push core inflation north of 3.5%. Accordingly, we’ve raised our estimate of U.S. recession risk in the year ahead from 30% to 35-40%.


Stunted growth?
Estimated tariff impacts on GDP for 2025 vary

Tariff impacts

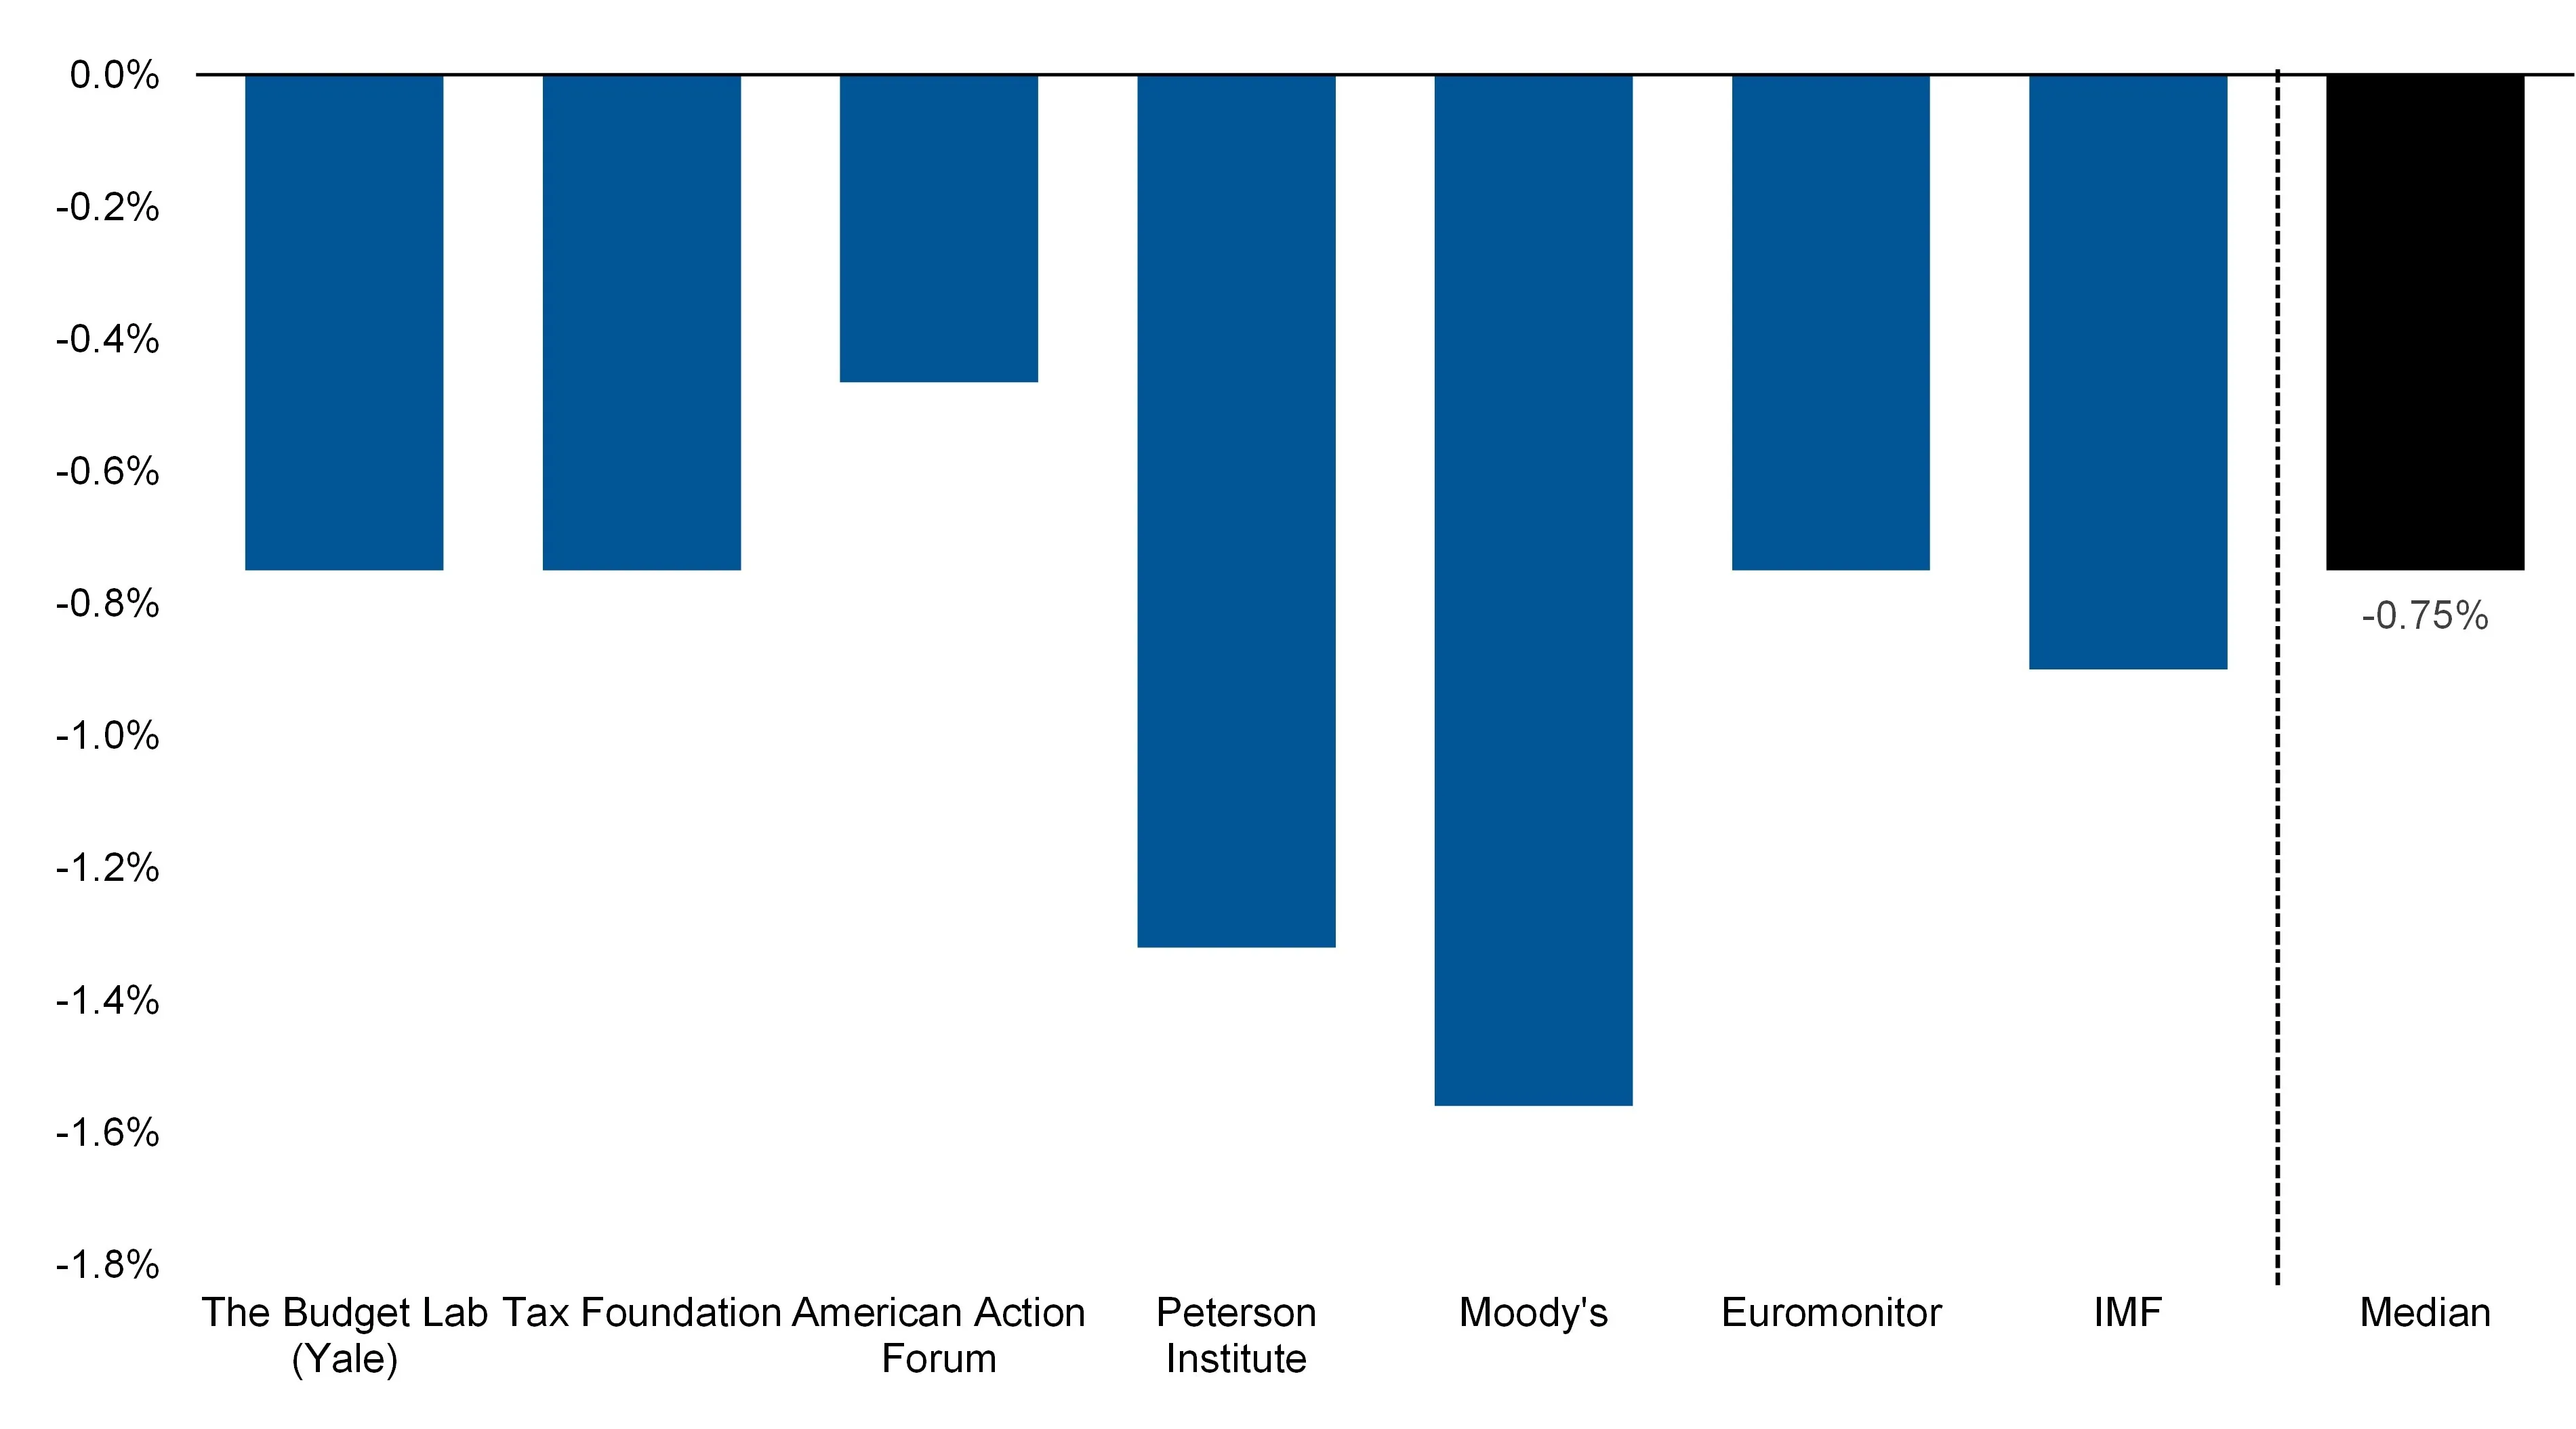
Source: Russell Investments adaptation of model-based estimates in "The Fiscal, Economic, and Distributional Effects of a 20% Broad Tariff" (The Budget Lab, 2025) and "How Will Trump's Universal and China Tariffs Impact the Economy?" (Tax Foundation, 2024). Our adaption assumes a 14-percentage-point increase in the U.S. effective tariff rate.

Pessimism not panic

U.S. markets were moderately risk-on through Wednesday's session, but sold off sharply Thursday morning. As of 8 a.m. Pacific time on Thursday, the S&P 500 was down approximately 4% and the Dow Jones had shed roughly 1,500 points. Meanwhile, Treasury yields declined by approximately 15 basis points as investors flocked to the safety of bonds.

We remain focused on holding diversified portfolio strategies into this period of extreme policy uncertainty. And we will be closely monitoring our measures of market psychology for potential dislocations in markets. Currently our signals show pessimism in the U.S. stock market but haven’t reached an extreme level of panic. Treasury yields at 4% are in line with our estimates of fair value for bonds.


These views are subject to change at any time based upon market or other conditions and are current as of the date at the top of the page. The information, analysis, and opinions expressed herein are for general information only and are not intended to provide specific advice or recommendations for any individual or entity.

This material is not an offer, solicitation or recommendation to purchase any security.

Forecasting represents predictions of market prices and/or volume patterns utilizing varying analytical data. It is not representative of a projection of the stock market, or of any specific investment.

Nothing contained in this material is intended to constitute legal, tax, securities or investment advice, nor an opinion regarding the appropriateness of any investment. The general information contained in this publication should not be acted upon without obtaining specific legal, tax and investment advice from a licensed professional.

Diversification and strategic asset allocation do not assure a profit or guarantee against loss in declining markets.

Please remember that all investments carry some level of risk, including the potential loss of principal invested. They do not typically grow at an even rate of return and may experience negative growth. As with any type of portfolio structuring, attempting to reduce risk and increase return could, at certain times, unintentionally reduce returns.

The Russell Investments logo is a trademark and service mark of Russell Investments

Any statements of opinion expressed within this publication are that of Russell Investments and are current at the time of issue. The information and opinion given in this publication is given in good faith. All opinions expressed are subject to change at any time. Russell Investments nor any of its staff accepts liability with respect to the information or opinions contained in this publication.

All investments carry a level of risk and do not typically grow at an even rate of return and could experience negative growth.

Any past performance results should not be seen as a guide to future returns. Any scenarios presented are an estimate of future performance based on evidence from the past on how the value of an investment varies and are not an exact indicator.

In EMEA this content is suitable for Professional Clients Only.

Russell Investments is committed to ensuring digital accessibility for people with disabilities. We are continually improving the user experience for everyone, and applying the relevant accessibility standards.

Russell Investments' ownership is composed of a majority stake held by funds managed by TA Associates Management, L.P., with a significant minority stake held by funds managed by Reverence Capital Partners, L.P. Certain of Russell Investments' employees and Hamilton Lane Advisors, LLC also hold minority, non-controlling, ownership stakes.

Frank Russell Company is the owner of the Russell trademarks contained in this material and all trademark rights related to the Russell trademarks, which the members of the Russell Investments group of companies are permitted to use under license from Frank Russell Company. The members of the Russell Investments group of companies are not affiliated in any manner with Frank Russell Company or any entity operating under the "FTSE RUSSELL" brand.

Issued by Russell Investments Limited. Company No. 02086230. Registered in England and Wales with registered office at: Rex House, 10 Regent Street, London SW1Y 4PE. Telephone +44 (0)20 7024 6000. Authorised and regulated by the Financial Conduct Authority, 12 Endeavour Square, London, E20 1JN.

© Russell Investments Group, LLC. 1995-2025. All rights reserved. This material is proprietary and may not be reproduced, transferred, or distributed in any form without prior written permission from Russell Investments. It is delivered on an "as is" basis without warranty.