


Aggregate duration measures a portfolio’s overall sensitivity to interest rate changes. Key rate duration shows how sensitive it is to changes at specific maturities along the yield curve. A portfolio can match its benchmark’s total duration while holding very different exposures at the two-year, seven-year or 30-year points.
Riti Samanta, Co-Head of Global Fixed Income, and Dylan Kelly, Senior Portfolio Manager, Overlay Solutions, examine how institutional investors can better identify and manage unintended interest rate risk across the yield curve.
Key takeaways:
- Overall duration can mask material interest rate exposures at specific points along the yield curve.
Non-parallel rate moves and changing portfolio construction can turn those exposures into benchmark-relative performance differences.
Key rate completion can help institutions manage these exposures while preserving flexibility in portfolio construction.
Duration management is a key function of fixed income portfolio management. However, as yields have moved approximately 100 bps in 2026 and the monetary regime has sharply changed from rate cuts to rate hikes, duration management has come into greater focus.
Alongside moves in the overall level of rates, investors have had to navigate a shifting yield curve, with its slope and rates at individual maturities moving in different ways. For example, around the April 7, 2026 tariff announcements, the 2s30s slope steepened as growth and recession concerns weighed more on the long end than on the 10-year point.
An investor who chooses to hedge interest rate risk at each of these points also takes a position on the way in which different parts of the yield curve might react differently to market events.
Yield curve mismatch in 2026
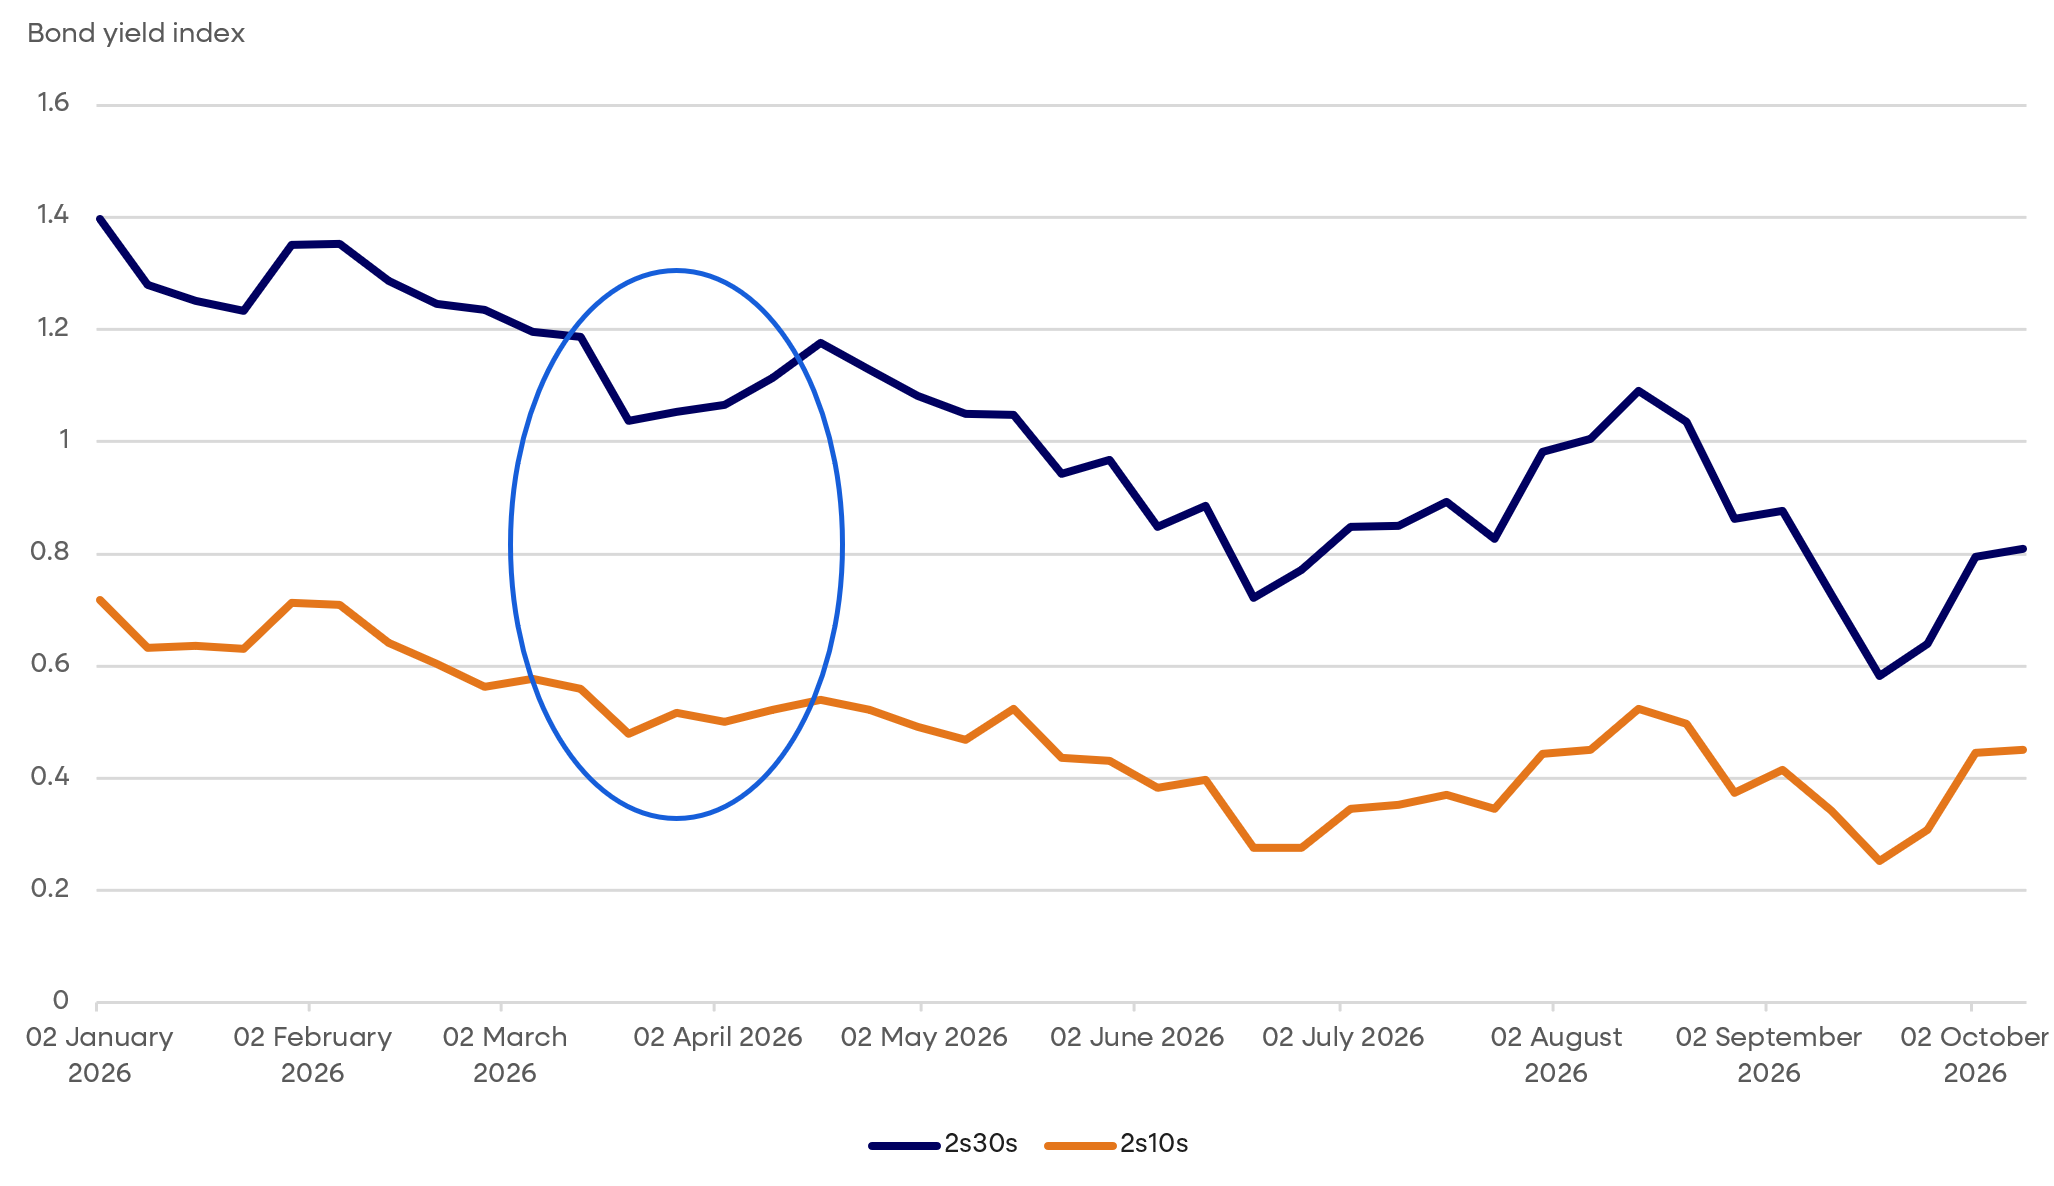
Source: Bloomberg data, October 2.
Matching exposure with duration challenge
A bond portfolio can be structured to achieve the same target level of overall duration in an almost infinite number of different ways. As a result, meeting an overall duration target does not necessarily protect an institution from movements in the yield curve and may in fact introduce several unintended risks and exposures. If a portfolio is expected to remain within 0.25 years of the duration of the benchmark, the same +0.25 could be achieved by being 2-years long at the 30-year point and short 1.75 years at the 2-year or neutral at the 2-year point and 0.35 years long around 7-years.
While the aggregate portfolio duration risk as measured relative to the benchmark is the same, the key rate duration exposures are vastly different and the impact on the portfolio of a 25 bps decline in the 2-year is materially negative in one case and neutral in the other. A portfolio may hold too much interest rate exposure at one maturity and too little at another, leaving it vulnerable to a steepening or flattening move that its aggregate duration does not capture.
Portfolio construction can amplify the challenge. Institutions may add shorter duration, floating rate, and securitised credit to manage interest rate or inflation risk, reducing exposure at some points along the curve. Long-dated issuance linked to areas such as artificial intelligence infrastructure can add sensitivity elsewhere as well.
Duration risk in practice
The illustrative portfolio below shows how unintended exposures on the yield curve can arise. In the case of multi-manager and multi-strategy portfolios, each individual strategy might be managing duration within guidelines and in line with rate expectations but create an unintended aggregate result.
The portfolio has not necessarily made a deliberate curve bet. Its position may simply reflect the interaction between different managers, strategies, and allocations. A manager may make a legitimate duration or curve decision within their mandate, but the combined effect can create exposures that are difficult to identify by reviewing each allocation separately.
A portfolio’s hedge ratio can remain above or below its 100% target at individual key rate durations (KRD)
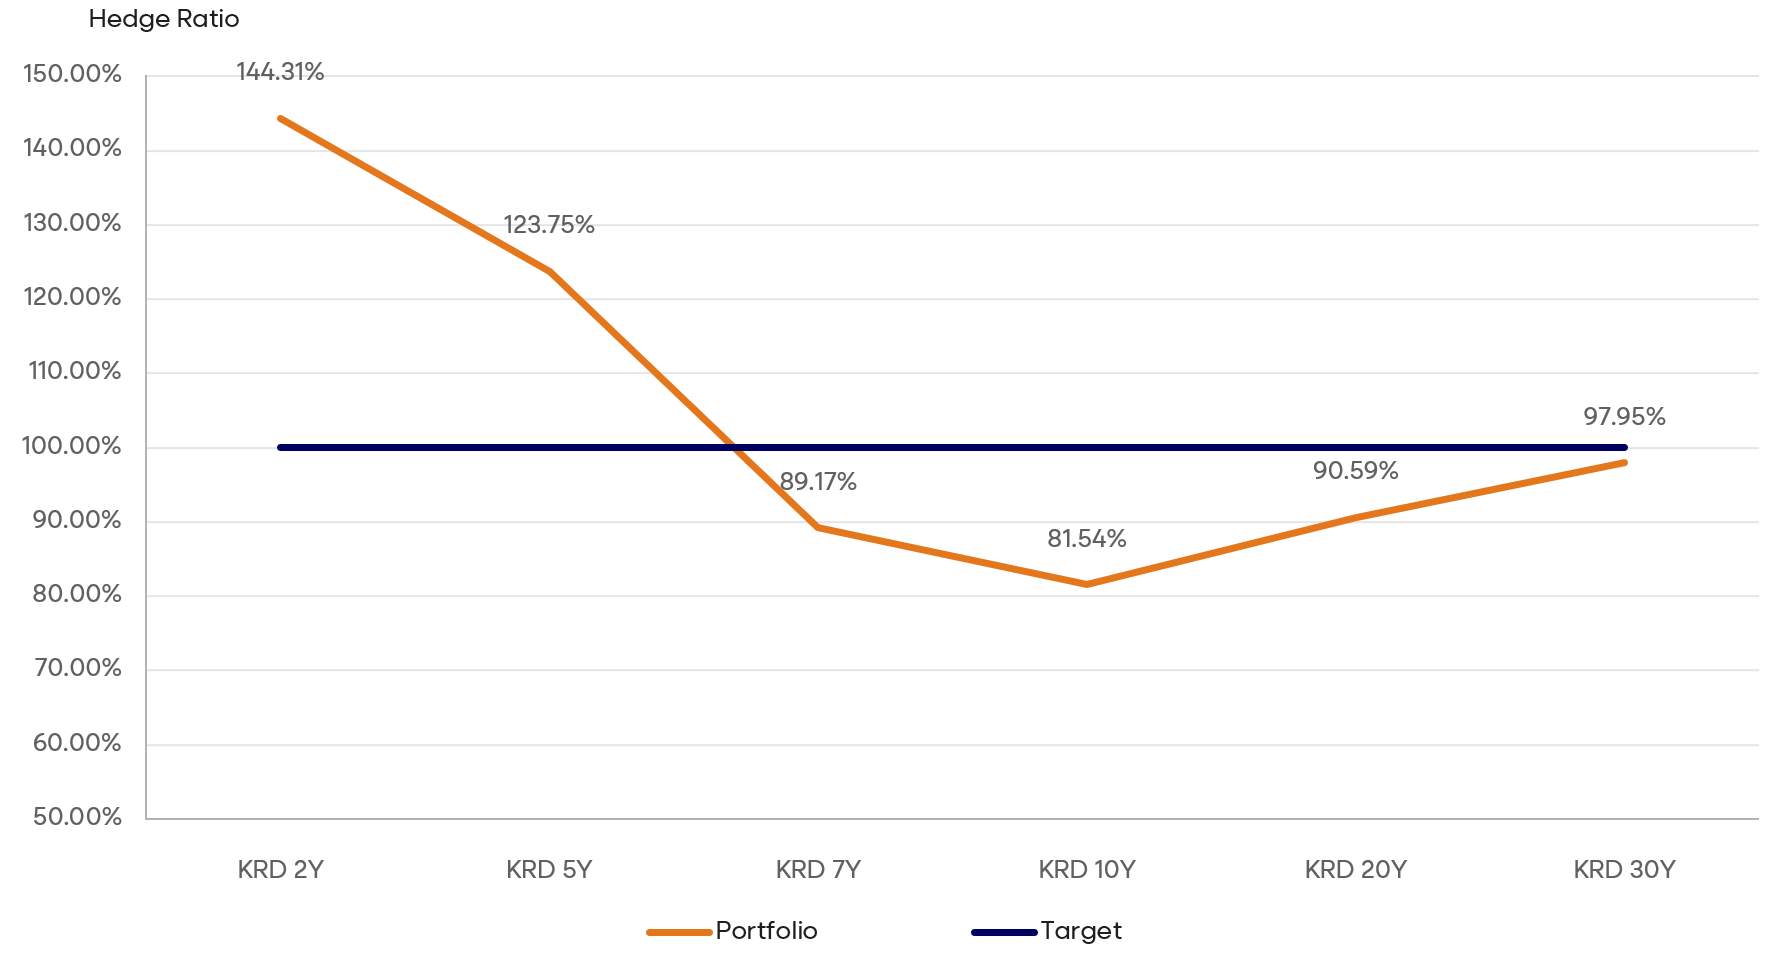
Illustrative example. Source: Russell Investments.
A portfolio’s hedge ratio following key rate completion
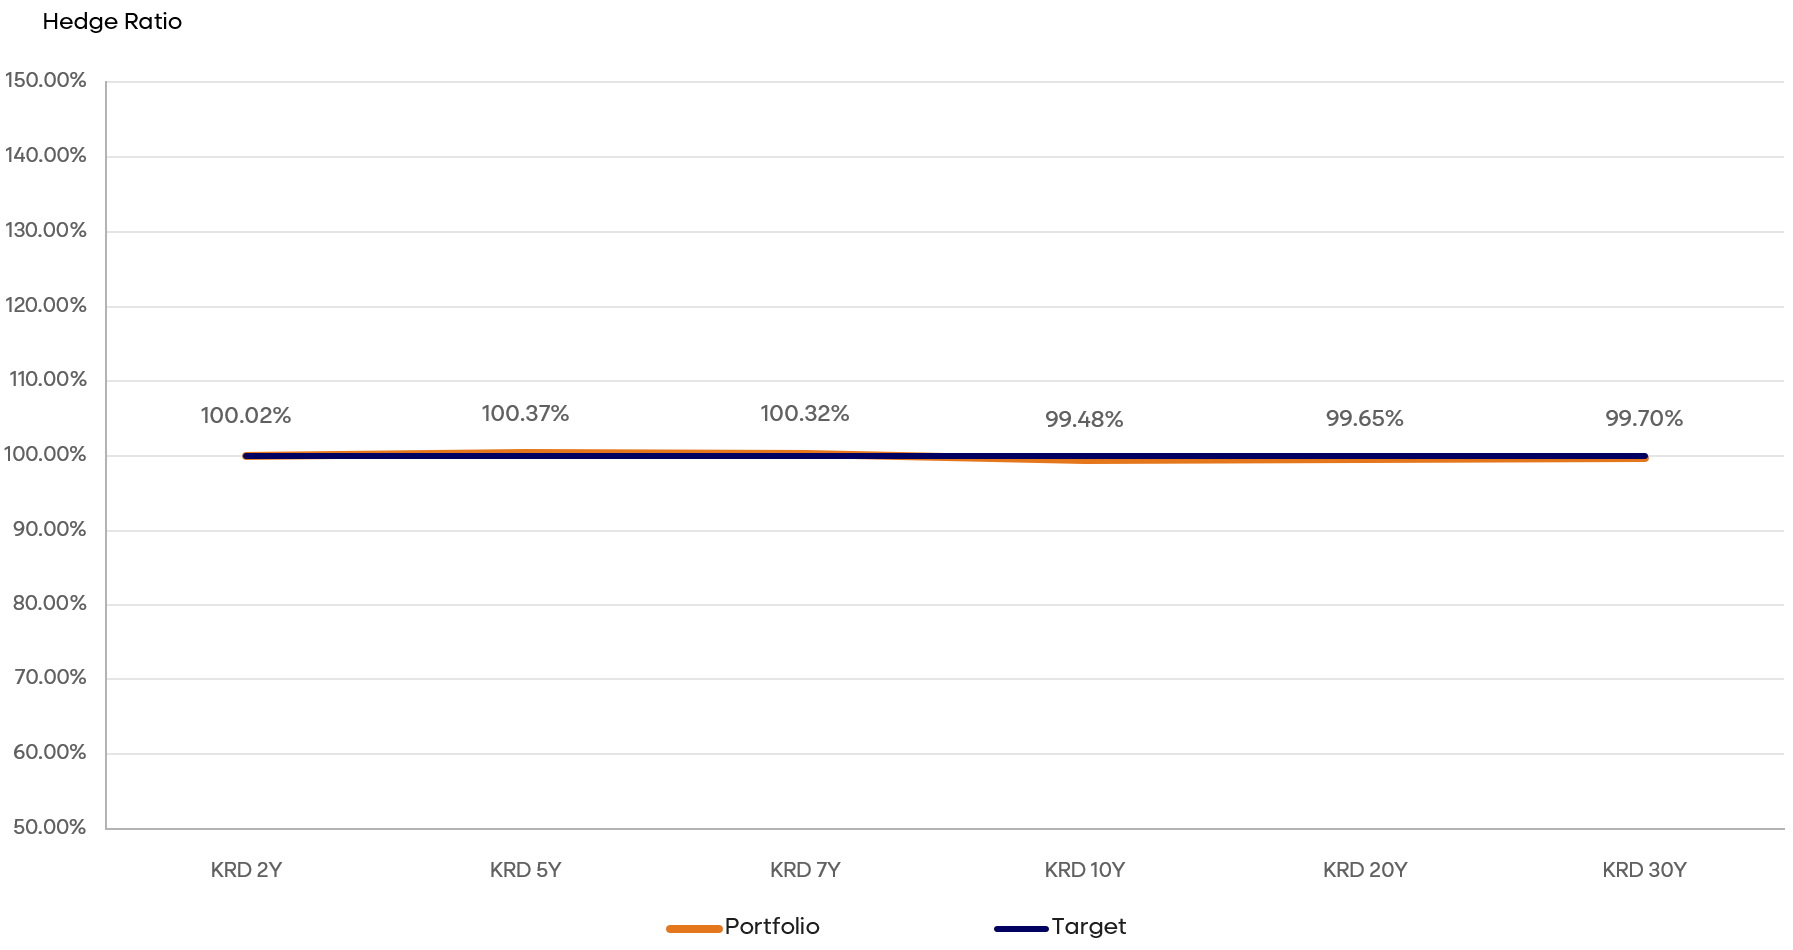
Illustrative example. Source: Russell Investments.
Why simple fixes can fall short
Institutions can respond to unintended exposures on the yield curve by adjusting manager allocations or adding Treasury bonds to the most underweight part of the curve or bringing overall duration back towards the benchmark. These approaches may work where the mismatch is limited and sufficient capital is available.
However, a broad hedge can address the headline figure without correcting the underlying curve position. For example, adding duration at one point may bring the portfolio within its permitted range while leaving it overexposed at the long end. The portfolio may therefore appear compliant with its overall target while remaining vulnerable at specific maturities. A change in the shape of the curve can expose that difference quickly.
Internal management also requires timely data, specialist analysis, and regular implementation. Manager positioning, new allocations, and changing holdings can all alter the portfolio’s profile. A process reviewed only periodically may allow mismatches to persist between review dates.
Implementation matters
The choice of instrument also matters when managing rate exposures. Treasury bonds may suit smaller adjustments, while futures or other derivatives can help institutions make several changes across the curve with less committed capital. Selecting and maintaining those instruments brings additional operational, legal, and governance requirements.
When expanding the investing toolkit to include derivatives, institutions can go both long and short at different points along the yield curve to reduce the mismatches against the benchmark. Treasury futures are very flexible and provide interest rate exposure across most of the key rate duration buckets.
Interest rate swaps can be useful for precise adjustments or for extending duration significantly. Total return swaps provide access to a range of benchmark exposures, including credit, securitized, and longer duration Treasury exposures linked to STRIPS, but offer less flexibility in adjusting position size.
Key rate completion
Key rate completion addresses unintended exposures along the yield curve by examining where the portfolio’s interest rate exposure differs from its benchmark. The process builds a detailed view of both profiles, allowing positive and negative differences to be identified at each key rate rather than compressed into a single duration figure (see the above illustrative portfolio, following key rate completion).
The appropriate instrument will depend on the size and nature of the mismatch, the portfolio’s liquidity profile, and the capital available. Treasury bonds, futures, and other derivatives may all have a role.
BMBR solution
Russell Investments’ BMBR (Benchmark MisMatch, Benchmark Replication) solution applies this process systematically, using agreed guardrails for monitoring, implementation, and reporting. The process is applied across the Russell Investments fixed income platform, hedging the duration risk of approximately $20bn of assets being managed against broad fixed income benchmarks.
The BMBR process starts by taking the underlying benchmarks of the exposures within a fixed income portfolio. For example, it might take a securitized benchmark, a corporate investment grade benchmark, and a Treasury benchmark to represent the assets broadly in a fixed income fund benchmarked to the Bloomberg U.S. Aggregate Index.
Each week, the key rate durations are calculated from the weighted benchmark exposures and active key rate duration bets that are larger than 0.25 years in absolute terms are neutralized by buying Treasury futures at the closest points along the curve. Once the completion portfolio is traded, the combination of the benchmarks and the futures portfolio is measured against the same tolerance levels to ensure there are no unintended breaches and risks.
This proprietary process has been developed systematically to create a repeatable process that reduces reliance on human judgement and bias while being implementable at scale. This same innovation can be used to help institutions manage benchmark-relative rate exposures while retaining flexibility in how the wider fixed income portfolio is constructed.
The approach does not remove the need for active investment decisions. Managers can continue to pursue credit, duration, and curve opportunities within their mandates. BMBR provides a framework for separating those intended decisions from exposures created by the interaction of the broader portfolio.
For instance, investors may be prioritizing risk reduction when they start the key rate completion journey but may soon discover that it also enhances their ability to express their views and generate alpha. There may be more degrees of freedom with the manager selection process, knowing that the duration will be brought back to target. Intentional tactical bets can also be expressed through customization of the benchmark, such as duration extension.
Investor implications
For investment teams, a systematic approach supported by the right implementation capabilities can reduce the operational burden of managing key rate duration risk. It can also free up capacity for manager selection, strategic allocation, and other investment decisions.
Institutions should look beyond asking whether a portfolio has the right amount of duration, but whether it is held in the right places for their objectives. Key rate completion can make those exposures more visible and support a more consistent approach to managing them.
Common client questions
Different managers, strategies, and allocations can combine to create curve exposures that were not deliberately chosen. Shorter duration or floating rate holdings may reduce sensitivity at some maturities, while long dated holdings can add it elsewhere. The resulting portfolio may match its benchmark’s aggregate duration but remain vulnerable to curve steepening or flattening.
A broad hedge can bring a portfolio’s overall duration closer to its benchmark without correcting mismatches at individual maturities. For example, adding duration at one point on the yield curve may meet an aggregate target while leaving the portfolio overexposed at the long end. Key rate analysis helps identify where adjustments are needed.
Key rate completion compares a portfolio’s interest rate exposures with those of its benchmark at individual points along the yield curve. It identifies where exposures are above or below target, helping institutions manage unintended benchmark-relative risk while retaining flexibility in manager selection and broader portfolio construction.
Russell Investments’ Benchmark Mismatch, Benchmark Replication (BMBR) process calculates key rate durations across underlying fixed income benchmarks each week. When active exposures exceed agreed thresholds, it can use Treasury futures to bring them closer to target. The process applies agreed monitoring, implementation, and reporting guardrails across the portfolio.