

Executive summary:
- Currency factor strategies can offer a counterweight to market turbulence in stocks and bonds. Our Absolute Return Currency Strategy (ARCS) is a transparent and rules-based strategy, offering exposure to three key currency factors: Carry, Value, and Trend.
- The ARCS has a low or even negative correlation with conventional assets, which gives it the potential to bolster multi-asset portfolio returns without adding much risk.
- We believe the future return prospects of ARCS look solid. This is because two indicators reflecting the strategy's potential have strengthened in recent years, surpassing their historical averages. These indicators pertain to the ARCS Carry and Value factors.
Over the last five years, financial markets grappled with two generational upheavals—the Covid pandemic and the subsequent inflation surge post the Russia-Ukraine conflict. Although global stocks reached new all-time highs in April 2024 and bonds appear to have formed a bottom, both asset classes fell together in 2022, undermining the diversification that investors expect from a multi-asset portfolio.
Currency factor strategies, an often overlooked asset class, may offer a counterweight to the occasional turbulence in stocks and bonds. Foreign exchange (FX) management is frequently neglected within the realm of multi-asset portfolio strategy. We believe that investors can add value by integrating an FX strategy into their portfolios. The Absolute Return Currency Strategy (ARCS) is a transparent and rules-based strategy, offering exposure to three key currency factors: Carry, Value, and Trend. Its low or even negative correlation with conventional assets offers the potential for bolstering multi-asset portfolio returns without adding much risk.
From the onset of the Covid pandemic in December 2019 until March 2024, ARCS recorded an annualized return of 1.4%, while offering diversification benefits to traditional assets. In Exhibit 1, we show the correlation of the daily returns of ARCS with (1) US aggregate bonds, (2) US large-cap stocks represented by the S&P 500 and (3) a 60-40 US stock-bond portfolio. During this tumultuous period, the correlation of ARCS was modestly negative with US bonds, slightly positive with US stocks and close to zero for the 60-40 portfolio.
Exhibit 1: Correlation of daily returns of ARCS with traditional assets
(Dec 2019 – Mar 2024)
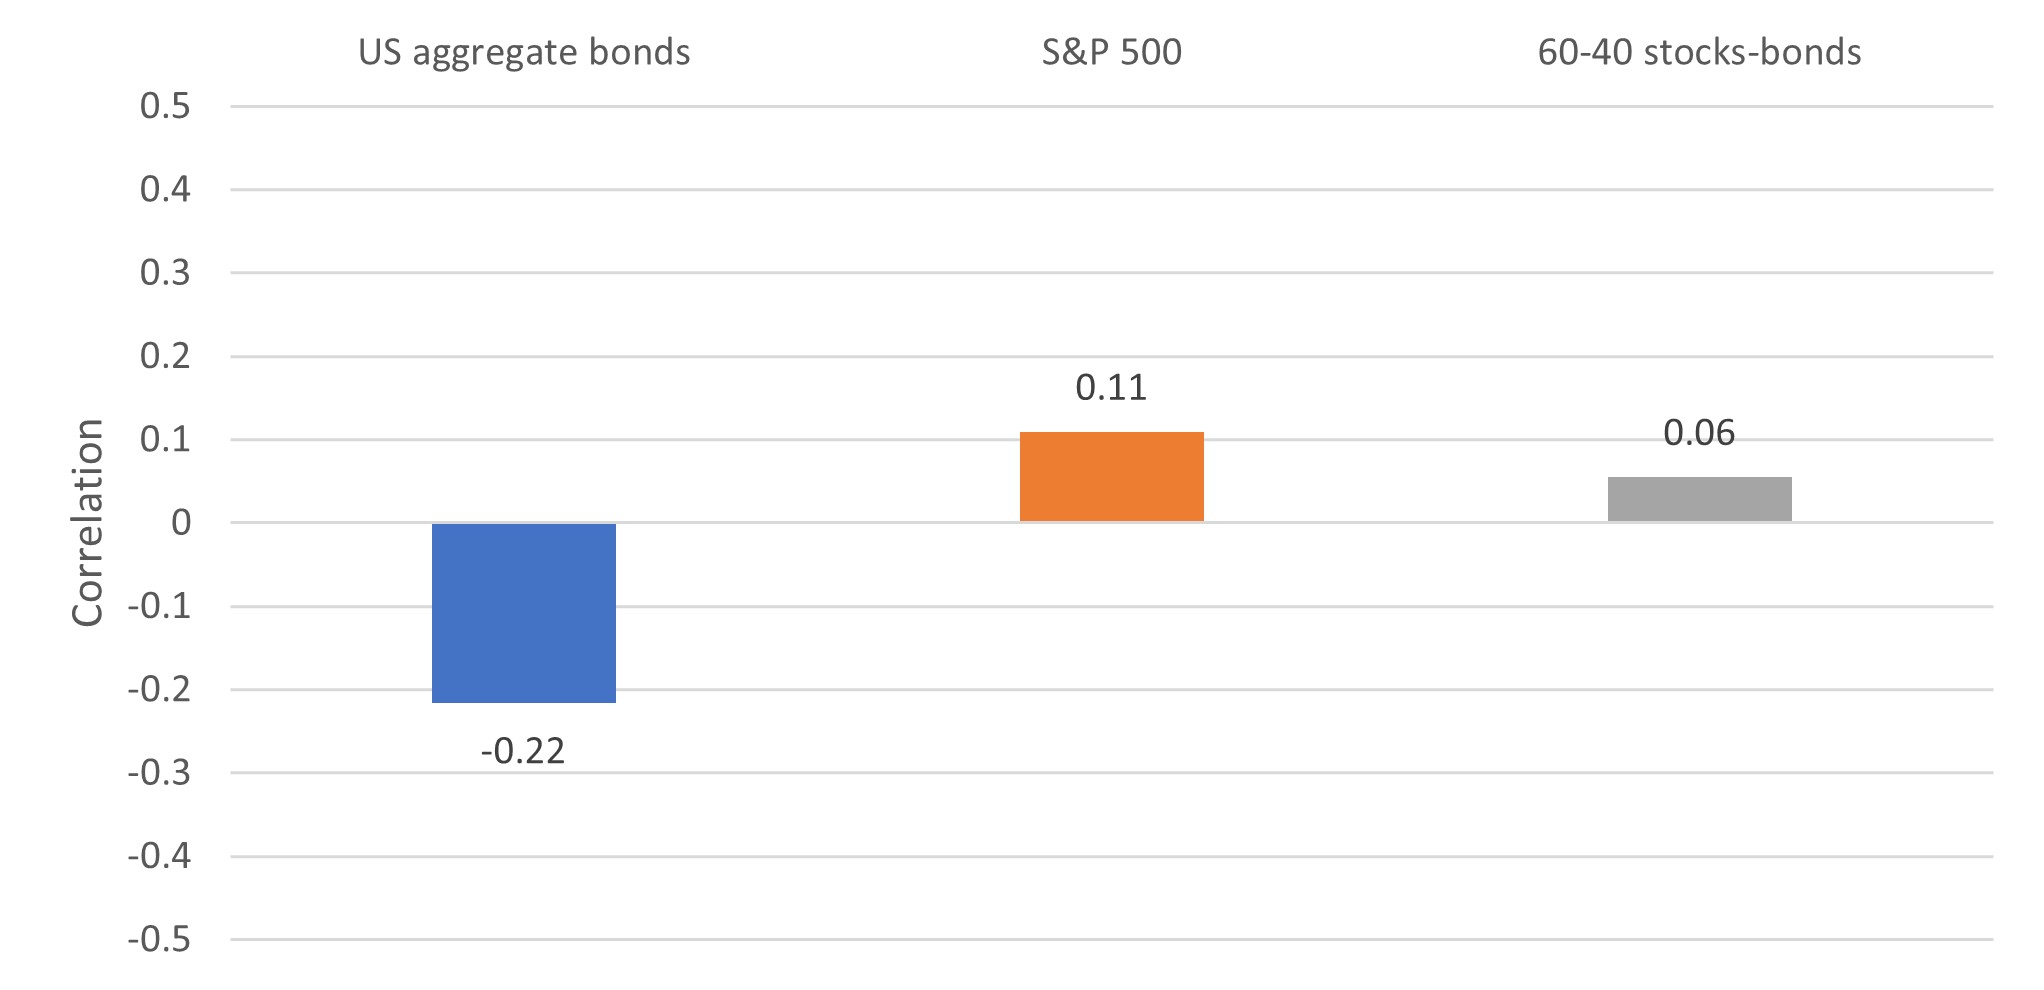
Source: Russell Investments, Bloomberg, Refinitiv Datastream, as of 31 March 2024
Institutional investors can incorporate the ARCS strategy into their portfolios as an FX overlay, implemented with currency forwards. This is a very efficient use of capital as it allows the rest of the portfolio to remain invested in equities, bonds and other long-only asset classes with minimal impact. In Exhibit 2, we compare the performance of a balanced portfolio comprising listed and illiquid assets without ARCS and the same balanced portfolio with a 20% ARCS overlay. While the addition of ARCS detracted during the sharp drawdown in Q1 2020, it subsequently improved the outcome during the recovery of financial markets in 2020 and 2021. Importantly, ARCS was also a welcome ballast in 2022 when stocks and bonds fell simultaneously. Cumulatively, a 20% ARCS overlay would have increased the return of a multi-asset portfolio by 150 basis points over the period.
Exhibit 2: Multi-asset portfolio total return with and without ARCS
(Dec 2019 = 1)
(Dec 2019 – Mar 2024)
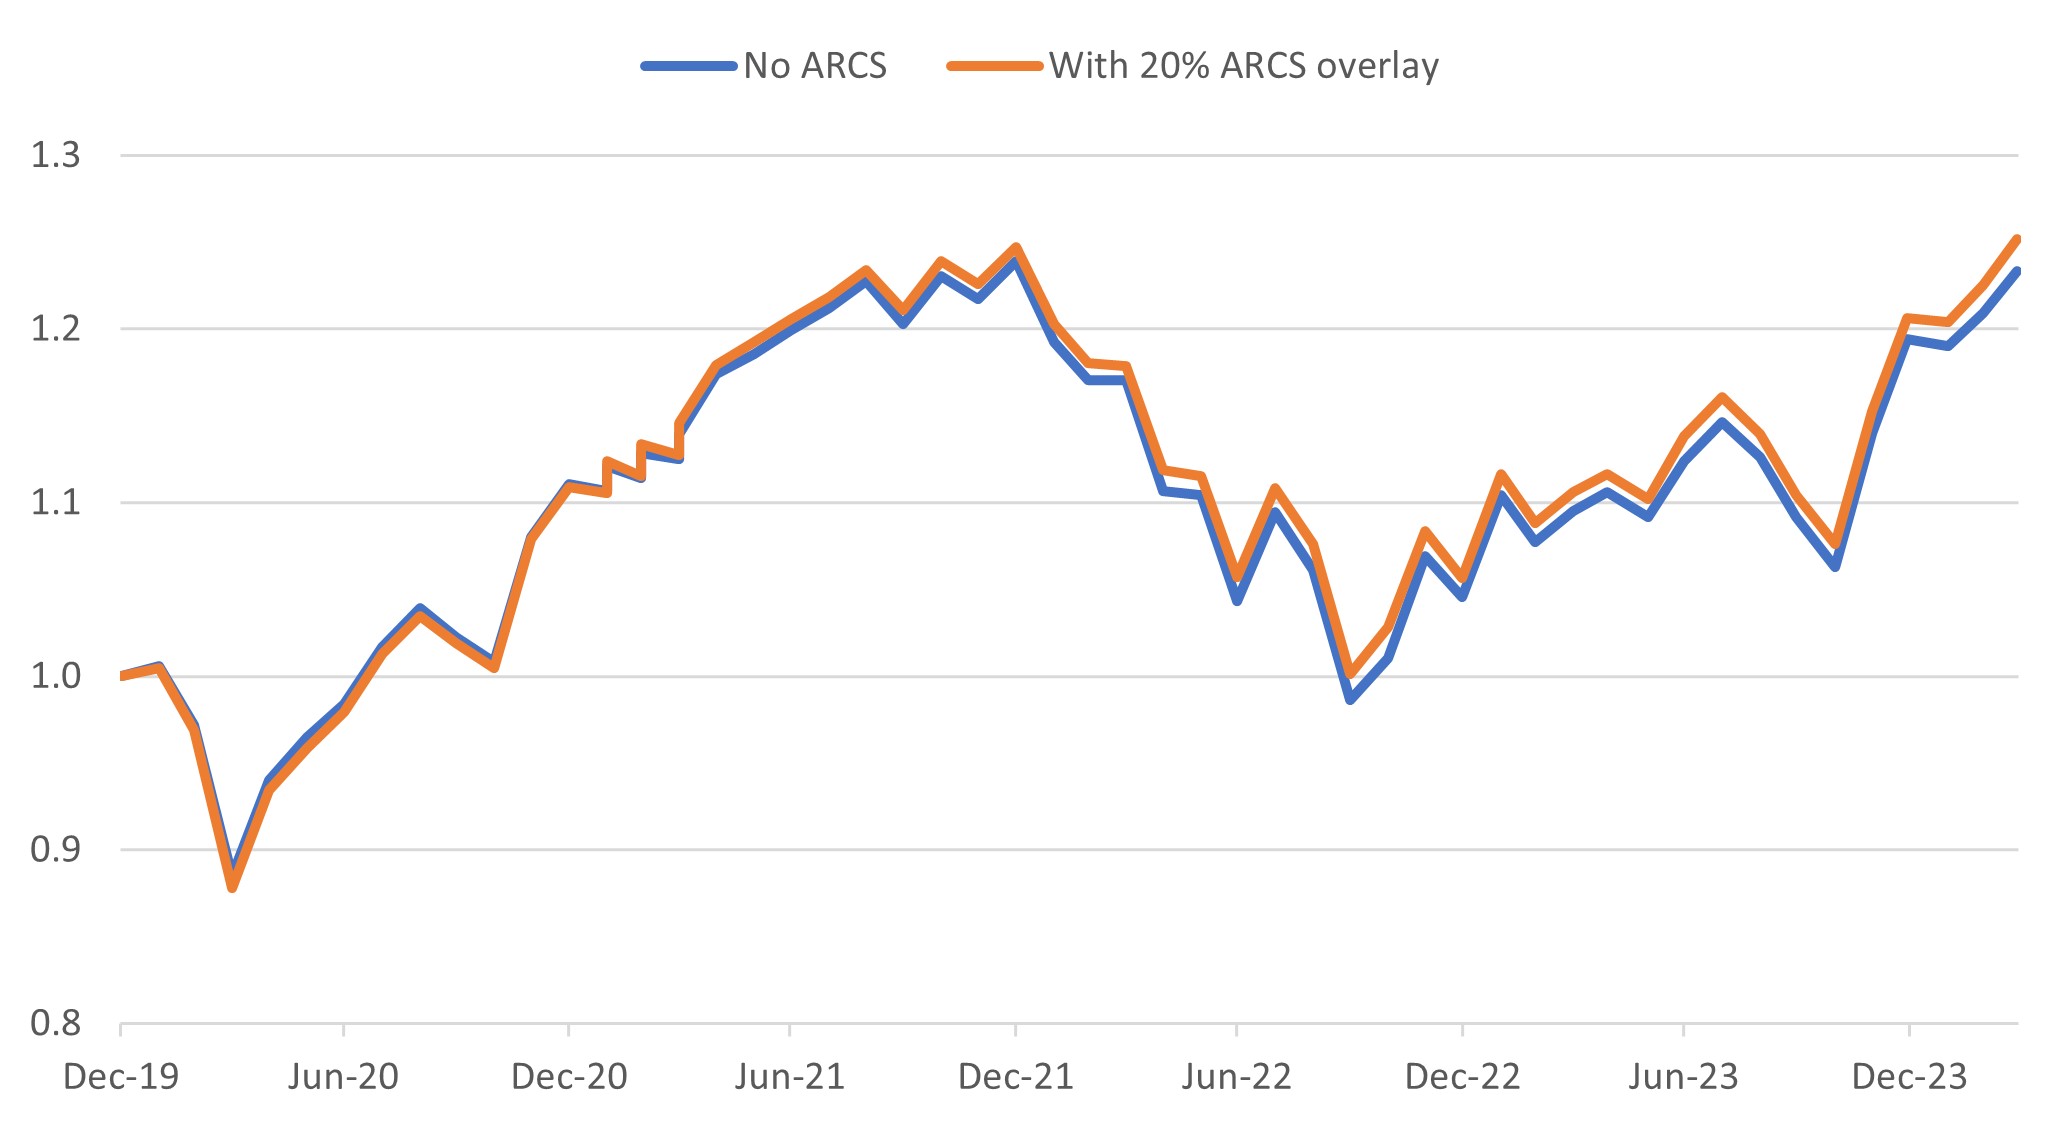
Source: Russell Investments, Bloomberg, as of 31 March 2024. For calculation purposes, we assume a U.S. balanced portfolio with the following allocations: 20% U.S. equities, 20% non-U.S. equities, 6% long U.S. government bonds, 20% U.S. aggregate bonds, 6% global HY bonds, 8% Global ex USA aggregate bonds, 5% domestic real estate, 5% hedge funds, 5% private equity and 5% cash. Non-U.S. equities, hedge funds, and private equity unhedged. Base currency USD.
Why ARCS now?
In our view, the return prospects of ARCS remain promising. Two indicators reflecting the strategy's potential have strengthened in recent years, surpassing their historical averages. These indicators pertain to the ARCS Carry and Value factors.
In ARCS Carry, we go long currencies which have the highest short-term interest rates and are short currencies at the opposite end of the rate spectrum. We can define the"Carry spread" as the difference in annualized interest rates of the long Carry basket and the short Carry basket. If spot exchange rates and interest rates stayed unchanged, the Carry strategy would earn this spread. In Exhibit 3, we plot the Carry spread against its full-sample mean and its 10-year moving average. The mean Carry spread of 3.4% is close to the return of the ARCS Carry strategy over the same period.
As of the end of April 2024, the Carry spread is 3.7%, slightly above its full-sample mean and well above its 10-year average of 2.5%. While this is an encouraging medium-term indicator of the return prospects of the ARCS Carry factor, it should be noted that the realized return can deviate significantly from it. A rising or stable Carry spread, like we experienced in the last two years, is more beneficial for the Carry factor return than a sharply declining spread (for example in 2008 or 2020).
Exhibit 3: Carry spread and averages
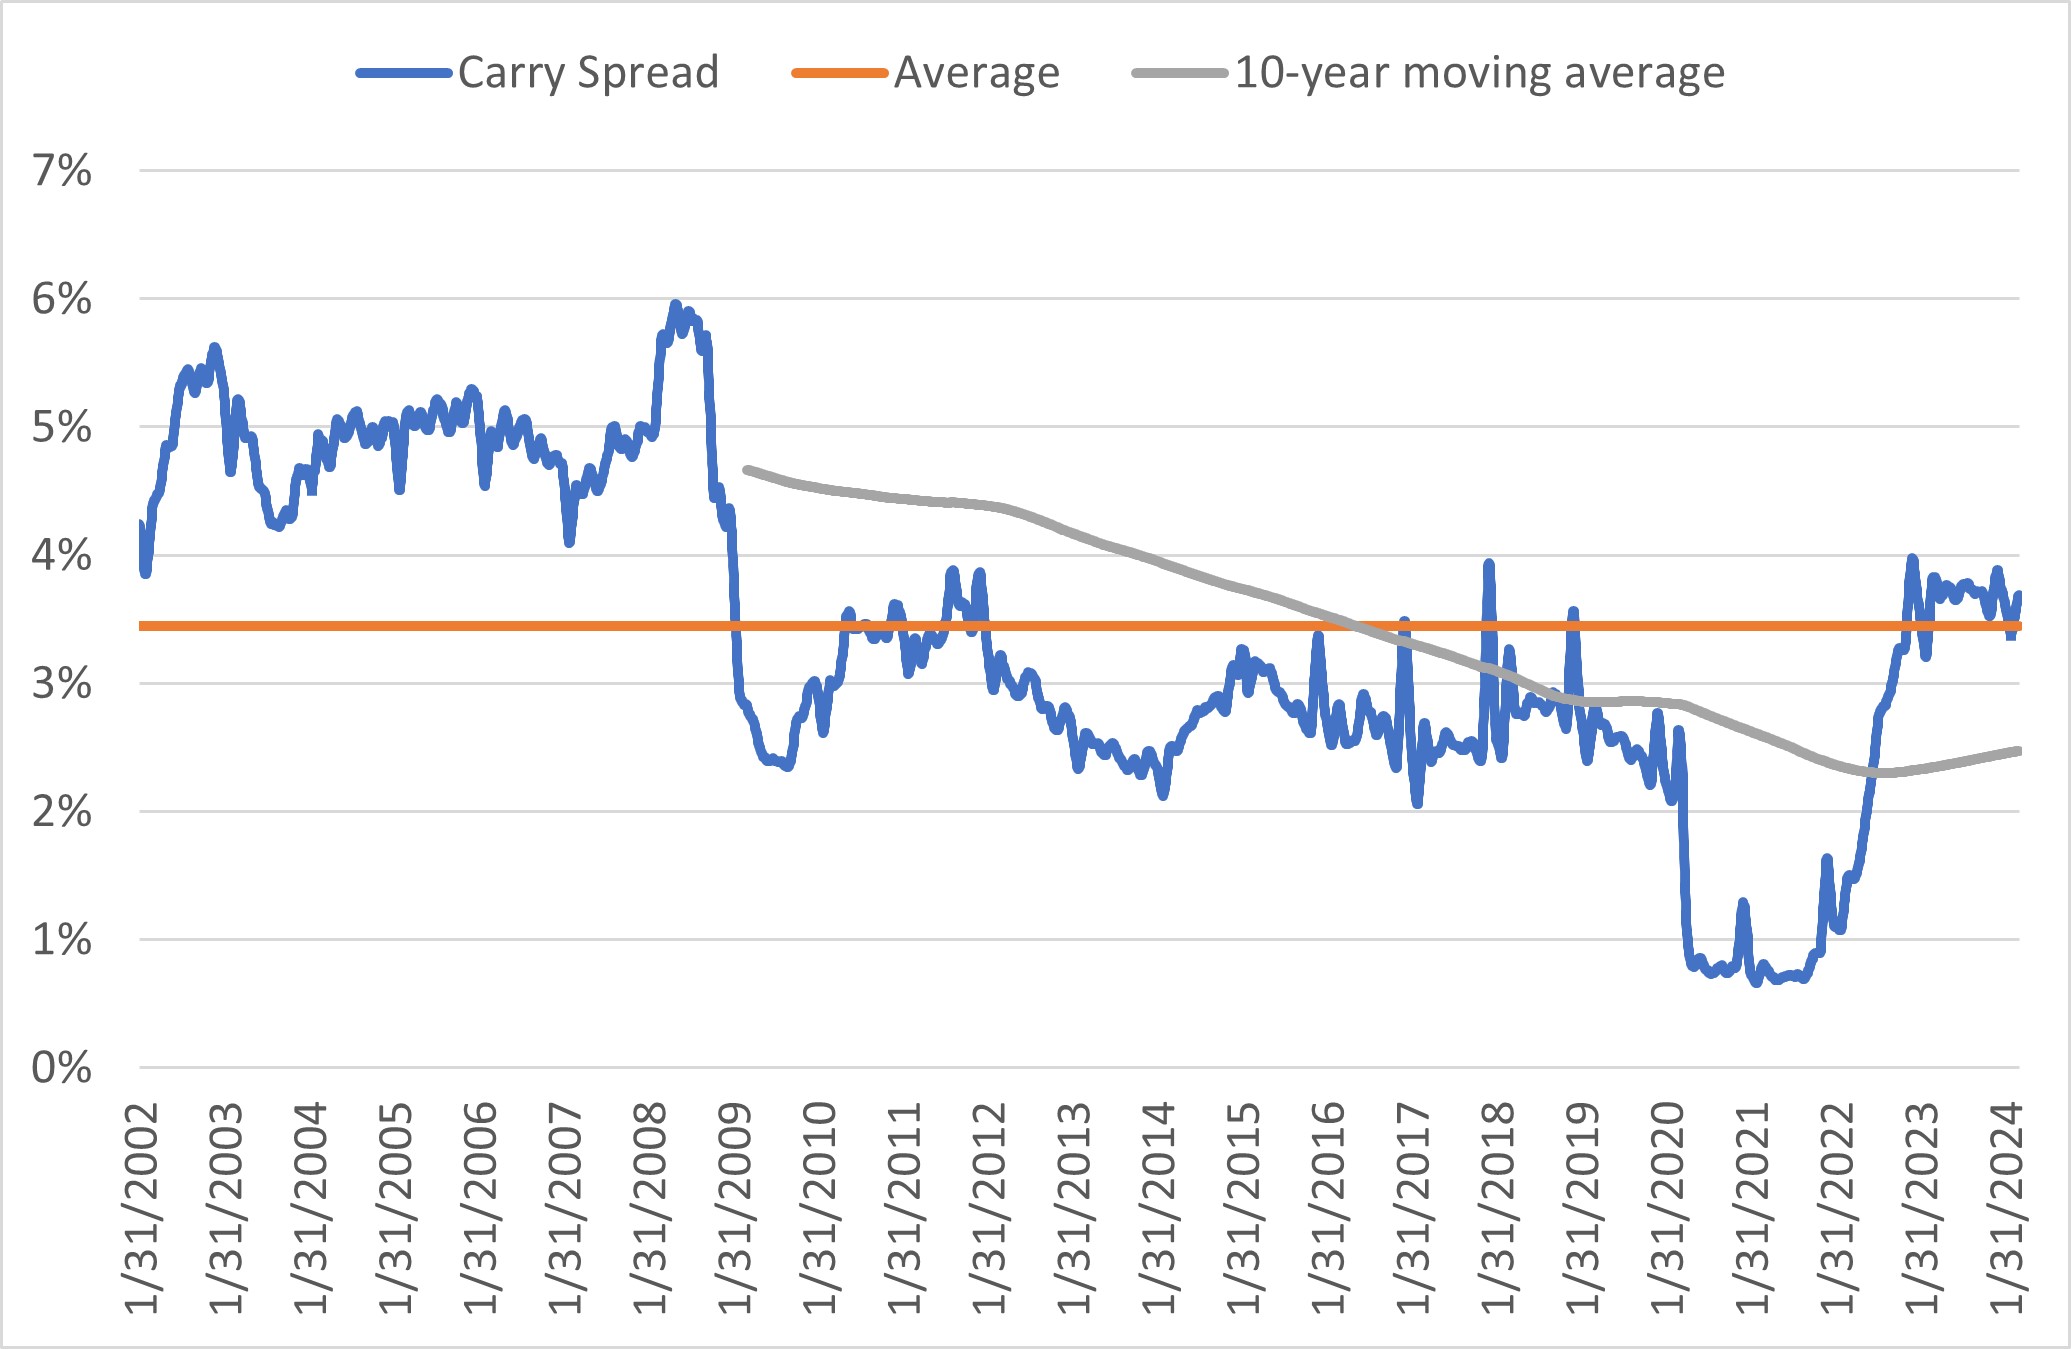
Source: Russell Investments, Bloomberg, as of 1 April 2024.
Turning to the ARCS Value factor, we can construct a similar forward-looking indicator, which we call the Value spread. Valuation is measured as the percentage deviation between a currency's spot exchange rate from its Purchasing Power Parity level (a notion of "equilibrium exchange rate") versus the U.S. dollar.1 The Value factor is long the "cheap" currencies whose exchange rate is below the equilibrium rate and short the "expensive" currencies at the other end of the spectrum. In analogy to the Carry spread, the Value spread is the difference in "misvaluations" between the long and the short Value currency baskets.
In Exhibit 4, we show the Value spread against its full-sample mean and 10-year average. As a metric of the Value factor's return prospects, the Value spread is at 39%, well above both averages (around 29%). The ARCS Value factor often experiences a drawdown when the Value spread widens (for example, 2020-2022). A falling Value spread is usually beneficial for the ARCS Value strategy (e.g., 2001-2006). From a relatively high starting point today, a fall in the Value spread becomes more likely. The spread has only been significantly higher during the early 2000's compared to today.
Exhibit 4: Value spread and averages

Source: Russell Investments, Bloomberg, as of 1 April 2024
The bottom line
Investors can use the disciplined systematic process of ARCS to capture the rewarded factors in foreign exchange markets. In our view, three factors that have lasted the test of time in currency markets are carry, value and trend. As interest rate differentials and valuation spreads between the G10 currencies have widened in recent years, we believe the expected return of ARCS is promising.
1The U.S. dollar is chosen as the reference currency for all three strategies, but the positions and returns are independent to the choice of the reference currency.