Calculator

Capital Gains SZN heats up: What investors could expect

2025-12-11

Michael Gavan

Michael Gavan

Associate Consulting Director


Find other posts with these tags:
Tax talk

Key takeaways

  • Capital gains distributions are higher in 2025 due to strong market returns.
  • Most equity categories expect increased distributions, especially growth and mid-cap segments.
  • Investors should assess tax exposure and redirect distributions to more tax-efficient solutions.

The year is winding down, but Cap Gains SZN is ramping up. It’s that time when the holidays bring together family, friends and shared traditions.  There is a natural pause to reflect on the year’s accomplishments and lessons learned. It also marks the period when fund families start to calculate their net realized capital gains.  For investors, “lessons learned” can take on a new meaning as they start to see what their tax bill could look like.

Around this time, most mutual fund and exchange-traded fund (ETF) providers release estimates of their upcoming distributions.  We track and aggregate these early numbers to help you better prepare for what to expect.  While the amounts won’t be final until distributions are officially announced and paid, with more than 75% of all funds having their estimates announced at this point, there is enough information to start assessing the broader picture.

Reflecting on 2025 market returns & historical distributions

Despite volatility early in the year, year-to-date market performance remains strong across the board. Focusing on equites, the Russell 3000 Index is up roughly 17.4% through the end of November, while international developed (MSCI EAFE Index) and emerging markets (MSCI EM Index) are up 24.5% and 29.5%, respectively, through the same time frame. So, the tradition of investors running into capital gains distributions is expected to continue and can potentially be a bit more widespread across asset classes given broader participation outside of U.S. equites.

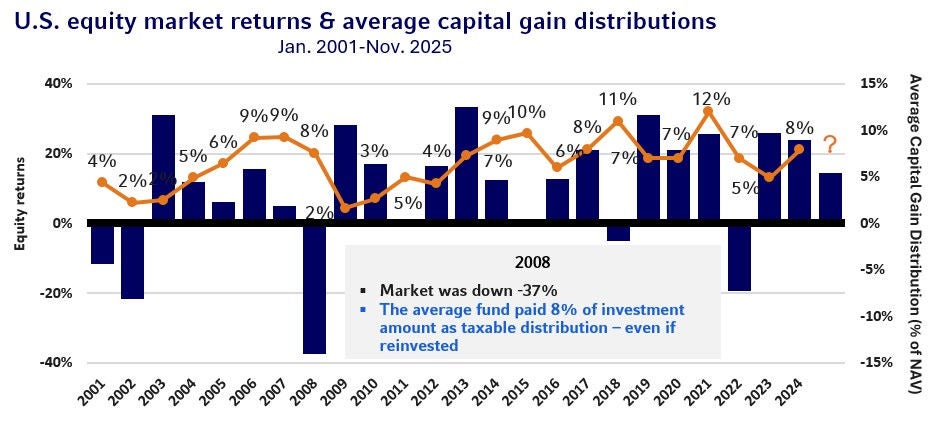
As shown in the chart below, capital gains are distributed annually—typically during the month of December—and happen regardless of how markets perform. In strong market years, like this one, a tax bill alongside positive performance seems like a natural trade-off. Strong performance adds pressure, but it’s the investment activity within the funds that causes taxable distributions.

Having a highly appreciated portfolio—something that many investors may have experienced lately—makes it harder for managers to incorporate active management decisions without tapping gains. That challenge grows when investor preferences lead to outflows, which can pressure managers to sell positions they otherwise wouldn’t touch. This is also why capital gains may still occur in down years.

U.S. equity market returns & average capital gain distributions

Source: Russell Investment & Morningstar Direct, 12/5/2025, unless noted. U.S. Stocks: Russell 3000® Index as of 11/30/2025. U.S. equity funds: Morningstar U.S. Category Group ‘U.S. Equity’ which includes mutual funds and ETFs (and multiple share classes). For years 2001 through 2020 % = calendar year cap gain distribution ÷ year-end NAV, 2021 through 2023 % = total cap gain distribution ÷ respective pre-distribution NAV. For years 2001 through 2013, used oldest share class. 2014 forward includes all share classes. Indexes are unmanaged and cannot be invested in directly. Returns represent past performance, are not a guarantee of future performance, and are not indicative of any specific investment.

The table below offers a snapshot of how this translates in dollar terms. We incorporated the average capital gain distribution paid by U.S. equity funds over the last 4 years (2021-2024) along with this year’s estimate of 8.1%. Assuming a $500k portfolio at the start of each year and applying the highest long-term capital gains tax rate (23.8%), that comes to roughly $6-$12k in tax each year. If this year plays out as estimated, that’s nearly $50k in taxes over the last 5 years.

average capital gain distribution paid by U.S. equity funds over the last 4 years

*Capital gain distribution percentages for 2021–2024 reflect actual average capital gain distributions, while the 2025 figure reflects an estimated average. All values are based on Morningstar U.S. Category Group ‘US Equity,’ which includes mutual funds and ETFs. **Represents maximum long-term capital gain tax rate of 20% for Married Filing Jointly and 3.8% Net Investment Income Tax.  Illustrative example only. Actual tax outcomes will vary. This is not tax advice. Please consult your tax advisor.

2025 – The broad view

With that backdrop in mind, it makes sense to start the broader asset-class discussion with U.S. equities. They tend to command the largest share of most investor portfolios and have also delivered some of the strongest multi-year returns across asset classes, which means they typically drive the bulk of capital gain distributions. This year is no exception as U.S. equity funds are expected to make the largest distribution relative to other major fund categories, averaging about 8.1%.

This isn’t much of a surprise as the Russell 3000 Index has delivered returns of +20% in five of the last six years and is up 17.4% year-to-date, so most funds are sitting on some hefty, embedded gains. Below, you will see a summary of distribution estimates within the U.S. equity category, broken down in style box form.

U.S. Equity Style Box

Source: Russell Investments & Morningstar Direct as of 12/5/2025.  Total number of funds expected to make a distribution is based on the funds that formally announced capital gains estimates. Currently 735 out of 939 for Large Value, 759 out of 1,054 for Large Blend, 699 out of 908 for Large Growth, 218 out of 325 for Midcap Value, 178 out of 313 for Midcap Blend, 290 out of 411 for Midcap Growth, 264 out of 388 for Small Value, 317 out of 461 for Small Blend, 300 out of 452 for Small Growth are expected to make a distribution. The calculation excludes funds that are not expected to make a distribution. For the details of the calculation and total number in each category, see disclosures.

First, across market cap, estimated distributions are coming in slightly higher across the board. Large cap funds are averaging 7%-10%, mid-cap 7%-11% and small cap 6% through 8%. Growth-oriented strategies are toward the top of each market cap segment.

Most categories are estimating distributions roughly 1 to 3 percent higher than what they paid out in 2024. Mid-cap growth stands out in particular; after paying the highest distribution among all U.S. equity segments last year, they are estimating an increase of about 3 percent for 2025.

Outside of U.S. equities, international equity estimates are coming in a bit higher than we have been used to, at 7.2% on average. This is partially due to their strong 2025 returns. The largest estimates are seen within smaller and more growth-oriented segments. Sector equity is coming in modestly lower at roughly 6% on average, with a wide range. Growth-leaning sectors are at the higher end, aligning with U.S. style-box trends, whereas real assets and defensive sectors are on the lower side.

Average Total Capital Gain Estimates

Source: Russell Investments & Morningstar Direct as of 12/5/2025.  Total number of funds expected to make a distribution is based on the funds that formally announced capital gains estimates. Currently 3,760 out of 5,251 for U.S. Equity, 1,691 out of 3,175 for International Equity, 449 out of 1,165 for Sector Equity, 64 out of 280 for Non-Traditional Equity, 18 out of 106 for Commodities, 2,718 out of 3,831 for Allocation, 64 out of 197 for Alternative are expected to make a distribution. The calculation excludes funds that are not expected to make a distribution. For the details of the calculation and total number in each category, see disclosures.

Non-traditional equity funds, which include funds focused on derivatives and long-short approaches, are tracking just under 6% on average. Given the nature of these strategies, they tend to be less tax-efficient, so expecting a mid-single digit average estimate isn’t surprising. 

Commodities and alternative funds are estimating to pay a distribution toward the lower end of the overall range, with most distributions classified as short-term rather than long-term. Allocation funds are estimating similar levels, with larger averages coming from more aggressive, equity heavy mixes, topping out at 5.7% on average.

Summary - Investor and advisor action steps

While we could go much deeper and dissect each asset class, fund family, or individual funds, investors should use this data as a broad starting point.  It can help identify areas that may not be aligned with their taxable interests.

Investors may consider not automatically reinvesting distributions if minimizing current-year tax drag is a priority. Instead, consider directing distributions to more tax‑efficient options that align with your objectives and circumstances. One way to pursue after‑tax wealth growth is to reduce tax drag where possible.


Important risk disclosures:

METHODOLOGY OF CALCULATING AVERAGE CAPITAL GAINS DISTRIBUTIONS OF FUND CATEGORY:
The average capital gain distribution as a % of Net Asset Value (NAV) is calculated using long term and short-term capital gain distributions as reported by respective fund families. % of NAV is calculated as ($ capital gain estimate ÷ NAV). For funds that report estimates as a range a mid-point is used [(low estimate + high estimate) ÷ 2]. It is important to understand the NAV date used in this calculation vary by fund family based on each company’s formal distribution announcement. Total Number of funds within each US Category Group: 6,629 for U.S. Equity, 3,836 for International Equity, 1,641 for Sector Equity, 636 for Non-Traditional Equity, 157 for Commodities, 5,877 for Allocation, 414 for Alternative. Total Number of funds within each Morningstar Category: 1,170 for Large Value, 1,386 for Large Blend, 1,088 for Large Growth, 423 for Mid-Cap Value, 403 for Mid-Cap Blend, 495 for Mid-Cap Growth, 488 for Small Value, 624 for Small Blend, 552 for Small Growth.

Investments in small cap, micro cap, and companies with capitalization smaller than the Russell 2000® Index, are subject to the risks of common stocks, may experience considerable price fluctuations and are more volatile than large company stocks. Generally, the smaller the company size, the greater the risks.


Non-U.S. markets, which may include developed, emerging, and frontier markets, entail different risks than those typically associated with U.S. markets, including currency fluctuations, political and economic instability, accounting changes and foreign taxation. Non-U.S. securities may be less liquid and more volatile than U.S. securities. The risks associated with non-U.S. securities may be amplified for emerging markets securities. Because frontier markets are among the smallest, least developed, least liquid, and most volatile of the emerging markets, investments in frontier markets are generally subject to a greater risk of loss than investments in developed or traditional emerging markets.


Commodities may have greater volatility than traditional securities. The value of commodities may be affected by changes in overall market movements, changes in interest rates or sectors affecting a particular industry or commodity, and international economic, political and regulatory developments. 


Alternative strategies may be subject to risks related to equity securities; fixed income securities; non-U.S. and emerging markets securities; currency trading, which may involve instruments that have volatile prices, are illiquid or create economic leverage; commodity investments; illiquid securities; and derivatives including futures, options, forwards and swaps.

INDEX DEFINITIONS:

Russell 3000® Index:
Index measures the performance of the largest 3000 U.S. companies representing approximately 98% of the investable U.S. equity market.

MSCI EAFE (Europe, Australasia, Far East) Index: A free float-adjusted market capitalization index that is designed to measure the equity market performance of developed markets, excluding the U.S. and Canada.

MSCI Emerging Markets Index: A float-adjusted market capitalization index that consists of indices in 24 emerging economies.

MORNINGSTAR FUND US CATEGORY GROUP DEFINITION:

U.S. Equity:
U.S. equity portfolios invest primarily in stocks of U.S. companies, spanning market-capitalization segments from small cap to large cap and investment styles from value to blend to growth. These strategies focus on companies listed or principally operating in the United States and are grouped by size and valuation characteristics—large, mid, and small categories, each with value, blend, or growth orientations. U.S. equity funds may target broadly diversified exposure across industries or emphasize specific risk and style factors tied to the U.S. stock market.

International Equity: International-equity portfolios invest primarily in non-U.S. stocks, including developed and emerging markets. These funds often diversify across countries such as Japan, the U.K., Germany, France, and emerging regions in Asia or Latin America. Categories within this group include foreign large-cap value, blend, and growth funds, as well as foreign small/mid-cap strategies and global allocations that invest primarily outside the United States. These portfolios typically hold less than 20% of assets in U.S. securities.

Sector Equity: Sector-equity portfolios concentrate investments in specific industries or economic sectors, such as technology, health, energy, real estate, communications, consumer cyclical, consumer defensive, natural resources, or financial services. These strategies seek capital appreciation by focusing exposure on companies whose prospects are tied to a particular sector. Because of their narrower focus, sector funds typically exhibit higher volatility and greater sensitivity to industry-specific trends than diversified equity funds.

Nontraditional Equity: Nontraditional-equity portfolios use alternative or derivative-driven strategies rather than straightforward long-only stock selection. These may include long–short equity, derivative-income strategies (such as covered-call overlays), equity-hedged approaches using protective options or market-timing, and defined-outcome structures that use options to cap upside and buffer downside. These funds typically exhibit lower beta to traditional equity markets and seek to manage or reshape equity risk through structured exposures.

Commodities: Commodity portfolios invest in physical commodities or commodity-linked derivatives, such as futures contracts tied to metals, energy, agriculture, livestock, or diversified commodity baskets. Some funds diversify across many commodity sectors, while others concentrate on specific industries such as energy or precious metals. These strategies often serve as inflation hedges or diversifiers because they behave differently from traditional equity and bond markets.

Allocation: Allocation portfolios invest in multiple asset classes — typically stocks, bonds, and cash — seeking a balanced mix of income, growth, and risk control. These strategies differ by the level of equity exposure, ranging from conservative (low equity) to aggressive (high equity), including target-date funds that shift allocations over time. Allocation funds are designed to provide diversified, risk-controlled portfolios appropriate for different investor objectives or time horizons.

Alternative: Alternative portfolios invest using nontraditional investment approaches or exposures beyond traditional stocks and bonds, often including derivatives, event-driven strategies, macro trading, relative-value arbitrage, multistrategy frameworks, or trend-following models. These strategies aim to provide diversification, reduce correlation to traditional markets, exploit market inefficiencies, or generate returns independent of equity and bond market direction. Many alternative strategies use short positions, leverage, or derivatives to reshape portfolio risk.

MORNINGSTAR FUND CATEGORY DEFINITION:

U.S. Fund - Large Value:
Large-value portfolios invest mainly in large U.S. companies that are less expensive or growing more slowly than other large-cap stocks. These portfolios favor companies with low valuations (low price ratios, high dividend yields) and slow growth characteristics. Stocks in the top 70% of the U.S. equity market by capitalization are defined as large cap.

U.S. Fund - Large Blend: Large-blend portfolios favor U.S. firms at the larger end of the market-capitalization range. Some aim to own an array of value and growth stocks while others employ a discipline that leads to holdings with valuations and growth rates close to the large-cap averages. Stocks in the bottom 10% of the capitalization of the U.S. equity market are defined as large cap. The blend style is assigned to portfolios where neither growth nor value characteristics predominate.

U.S. Fund - Large Growth: Large-growth portfolios invest primarily in big U.S. companies expected to grow faster than other large-cap stocks. These portfolios emphasize firms with high growth rates for earnings, sales, book value, and cash flow, which often leads to higher valuations (high price ratios and low dividend yields). Most focus on rapidly expanding industries. Stocks in the top 70% of U.S. market capitalization are considered large cap.

U.S. Fund – Mid-Cap Value: Mid-cap value portfolios invest in medium-sized U.S. companies that are less expensive or growing more slowly than the overall market. These portfolios focus on firms with low valuations and slower growth in earnings, sales, book value, and cash flow. Stocks in the middle 20% of U.S. market capitalization are considered mid-cap.

U.S. Fund – Mid-Cap Blend: Mid-cap blend portfolios invest in U.S. stocks of various sizes and styles, giving them a middle-of-the-road profile. These portfolios typically avoid both high-priced growth stocks and deeply discounted value stocks. Stocks in the middle 20% of U.S. market capitalization are defined as mid-cap. The blend style applies when neither growth nor value characteristics dominate.

U.S. Fund – Mid-Cap Growth: Mid-cap growth portfolios target U.S. companies projected to grow faster than other mid-cap stocks. These businesses tend to have higher prices relative to fundamentals and are often found in expanding industries. Stocks in the middle 20% of the U.S. equity market capitalization are considered mid-cap. Growth is defined by fast growth rates and high valuations.

U.S. Fund - Small Value: Small-value portfolios invest in small U.S. firms with valuations and growth rates below those of other small-cap peers. These companies tend to have lower price ratios, higher dividend yields, and slower growth rates. Stocks in the bottom 10% of U.S. equity market capitalization are defined as small cap. Value is defined by inexpensive valuations and slower growth fundamentals.

U.S. Fund - Small Blend: Small-blend portfolios favor U.S. firms at the smaller end of the market-capitalization range. Some aim to own an array of value and growth stocks while others employ a discipline that leads to holdings with valuations and growth rates close to the small-cap averages. Stocks in the bottom 10% of the capitalization of the U.S. equity market are defined as small cap. The blend style is assigned to portfolios where neither growth nor value characteristics predominate.

U.S. Fund - Small Growth: Small-growth portfolios focus on faster-growing U.S. companies in the lower end of the market-capitalization range. These portfolios typically emphasize younger firms or companies in dynamic industries. Because these companies grow quickly and tend to be richly valued, their stocks are generally more volatile. Stocks in the bottom 10% of U.S. market capitalization are considered small cap. Growth is defined by rapid growth and high valuations.

©2025 Morningstar, Inc. All rights reserved. The information contained herein: (1) is proprietary to Morningstar and/or its content providers; (2) may not be copied or distributed; and (3) is not warranted to be accurate, complete, or timely. Neither Morningstar nor its content providers are responsible for any damages or losses arising from any use of this information. Past performance is no guarantee of future results.

Russell Investment Company mutual funds are distributed by Russell Investments Financial Services, LLC, member FINRA, part of Russell Investments.

The information, analyses and opinions set forth herein are intended to serve as general information only and should not be relied upon by any individual or entity as advice or recommendations specific to that individual entity. Anyone using this material should consult with their own attorney, accountant, financial or tax adviser or consultants on whom they rely for investment advice specific to their own circumstances.

Products and services described on this website are intended for United States residents only. Nothing contained in this material is intended to constitute legal, tax, securities, or investment advice, nor an opinion regarding the appropriateness of any investment, nor a solicitation of any type. The general information contained on this website should not be acted upon without obtaining specific legal, tax, and investment advice from a licensed professional. Persons outside the United States may find more information about products and services available within their jurisdictions by going to Russell Investments' Worldwide site.

Russell Investments is committed to ensuring digital accessibility for people with disabilities. We are continually improving the user experience for everyone, and applying the relevant accessibility standards.

Russell Investments' ownership is composed of a majority stake held by funds managed by TA Associates Management, L.P., with a significant minority stake held by funds managed by Reverence Capital Partners, L.P. Certain of Russell Investments' employees and Hamilton Lane Advisors, LLC also hold minority, non-controlling, ownership stakes.

Frank Russell Company is the owner of the Russell trademarks contained in this material and all trademark rights related to the Russell trademarks, which the members of the Russell Investments group of companies are permitted to use under license from Frank Russell Company. The members of the Russell Investments group of companies are not affiliated in any manner with Frank Russell Company or any entity operating under the "FTSE RUSSELL" brand.

© Russell Investments Group, LLC. 1995-2025. All rights reserved. This material is proprietary and may not be reproduced, transferred, or distributed in any form without prior written permission from Russell Investments. It is delivered on an "as is" basis without warranty.