

Key takeaways:
- Smaller public plans appear meaningfully under-allocated to private equity and hedge funds compared to larger peers and many have no exposure to alternatives at all.
- The return gap between smaller and larger plans diverges across three-, five- and 10-year periods.
- With the right implementation model, smaller plans may be able to access alternatives more effectively.
Public pension plans have a clear objective: to generate enough investment earnings—in combination with contributions—to pay promised benefits while managing risk. In the pursuit of greater yield to meet these needs, larger public plans have turned to alternative investments such as private equity, hedge funds and real estate.
However, for many smaller plans, alternatives remain underutilized, often because of governance, resource and implementation constraints. As a result, public pension portfolios can look very different depending on plan size, raising important questions about access, implementation and long-term investment outcomes.
The alternatives gap is real
Data suggests that alternatives allocations vary greatly by the size of pension plans. Figure 1 below shows the average asset allocation by public plan size, broken into three groupsi. The pattern is clear. Larger public pension plans, on average, allocate more to private equity and hedge funds than smaller plans. This may be a missed opportunity as these alternative assets offer compelling return enhancement and diversification benefits.
For plans with less than $1 billion in assets, the average private equity allocation is 7.4%, compared with 9.8% for plans between $1 billion and $10 billion, and 11.7% for plans above $10 billion. Larger plans have made private equity a meaningful part of their pension assets.
Public pension plans: Asset allocation comparison by Plan Size
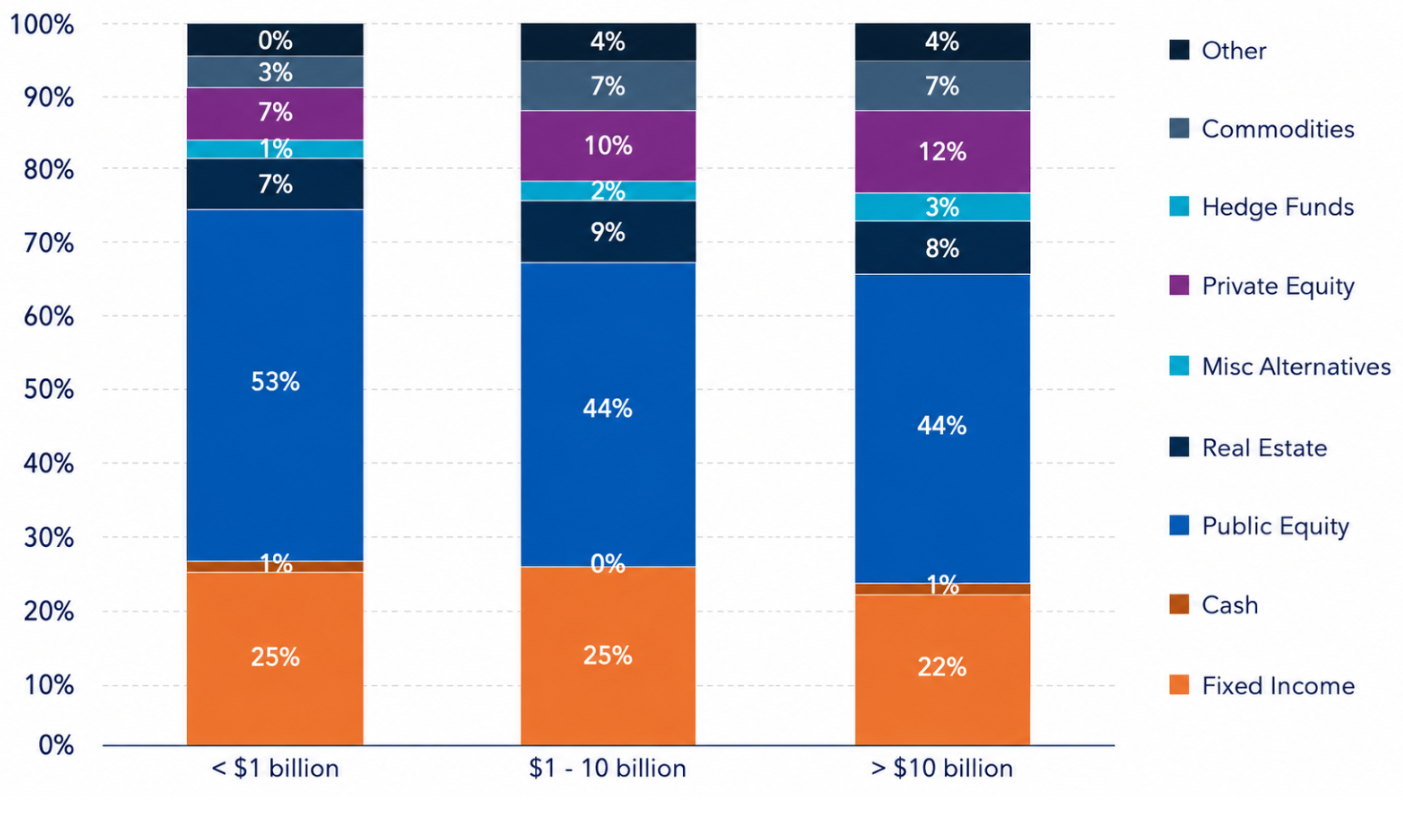
Figure 1: Public Pension Plan comparison of asset allocation. Source: Public Plans Data. 2024. Center for Retirement Research at Boston College, MissionSquare Research Institute, National Association of State Retirement Administrators, and the Government Finance Officers Association, and Russell Investments calculations.
The contrast is also notable in hedge funds. Plans below $1 billion average 3% in hedge funds, while plans between $1 billion and $10 billion and those over $10 billion average approximately 7%. These differences may not seem large in isolation, but at the total portfolio level, a few small adjustments in portfolio construction can materially affect diversification, risk control and long-term return potential.
Real estate is more consistent across plan sizes, with all three cohorts averaging 7-9% allocations. This suggests that some alternative categories have become more accepted across the public plan universe than others, with private equity and hedge funds showing a meaningful size-based divide.
Participation diverges too
Average allocations only tell part of the story. Figure 2 below shows the percentage of plans with an allocation to real estate, private equity and hedge funds.ii
Percent of plans with at least 1% allocation to asset class by Plan Size
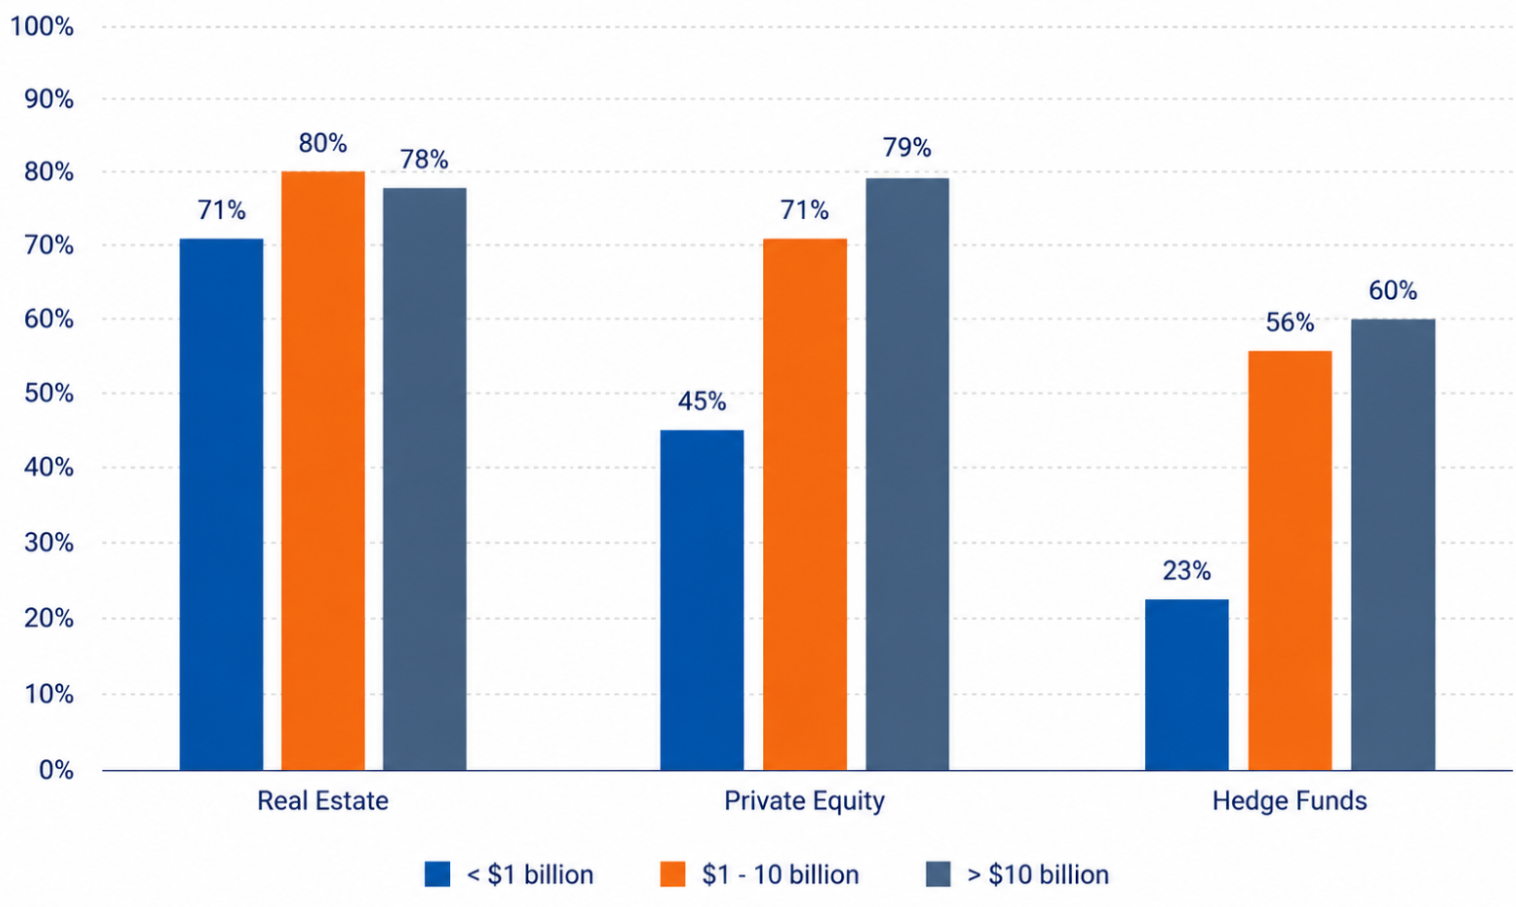
Figure 2: Public Pension Plan comparison of allocations in select asset classes. Public Plans Data. 2024. Center for Retirement Research at Boston College, MissionSquare Research Institute, National Association of State Retirement Administrators, and the Government Finance Officers Association, and Russell Investments calculations.
Among plans with less than $1 billion in assets, only about 45% have an allocation to private equity, while over 70% of plans in both larger size cohorts invest in private equity.
The gap is even more dramatic for hedge funds. Only 23% of smaller plans have an allocation to hedge funds. By contrast, 56% of plans between $1 billion and $10 billion, and 60% of plans over $10 billion have an allocation to hedge funds.
The issue is not only that smaller plans have lower allocations. In many cases, they have no allocation at all. That means public plans may be missing entire sources of return and diversification that larger plans have already incorporated into their portfolios.
For public pension boards, this should not automatically lead to the conclusion that every plan needs a large private equity or hedge fund allocation. Every plan has different liquidity needs, governance capacity, funded status and risk tolerance, but it should prompt serious consideration of their inclusion.
The return gap
Figure 3 compares average investment returns across three-, five- and 10-year periods by plan size. The results show a consistent pattern: larger plans have generated higher average returns.iii
Investment return comparison by Plan Size
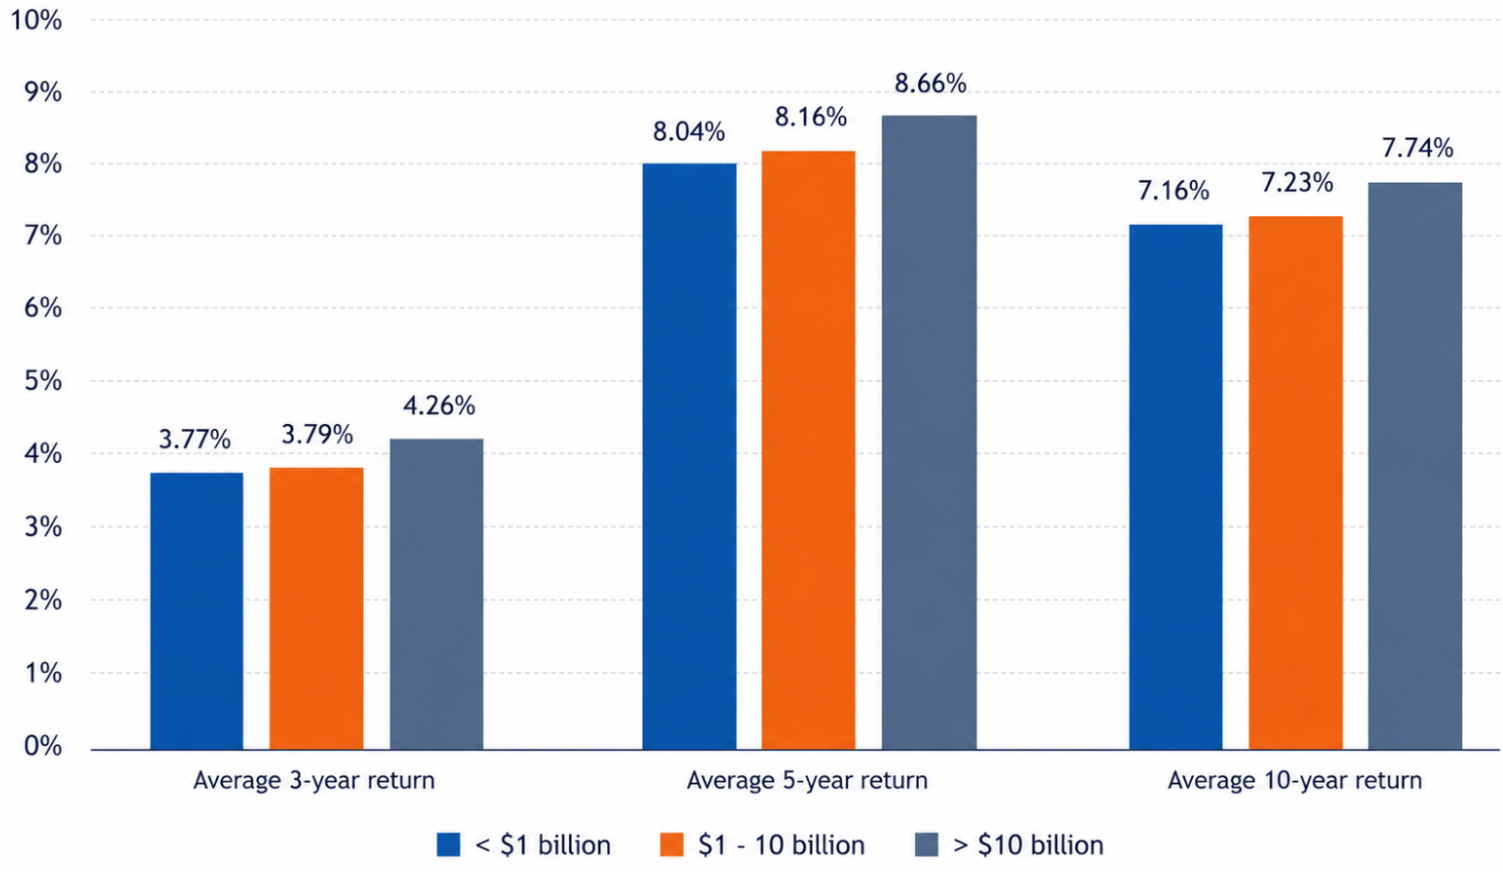
Figure 3: Public Pension Plan comparison of investment returns. Public Plans Data. 2024. Center for Retirement Research at Boston College, MissionSquare Research Institute, National Association of State Retirement Administrators, and the Government Finance Officers Association, and Russell Investments calculations.
The average three-year return for plans under $1 billion in assets was 3.8%, while plans above $10 billion averaged 4.3%. Over five years, smaller plans averaged 8.0%, while the largest plans averaged 8.7%. Over 10 years, smaller plans averaged 7.2%, compared with 7.7% for the largest plans.
A half percentage point may not sound transformational in any single year, but pension investing is a compounding exercise. Over long periods, modest return differences can materially affect funded status, required contributions and the pressure placed on taxpayers and employees. Moreover, the largest plans may have also achieved higher returns with better diversification and therefore might experience lower return volatility.
Importantly, alternative investments are not risk-free and are not immune to drawdowns, but a well-constructed mix of private markets, real assets and diversifying strategies can reduce reliance on public equity markets as the primary growth engine. For plans that are currently heavily dependent on public equities for return generation, diversification can be valuable—especially during periods of market stress.
Why have smaller plans hesitated?
The reasons smaller plans have lower average alternative asset allocations are understandable. Alternative investments are more complex than traditional public equity and fixed income strategies. They often involve limited partnerships, capital calls, less frequent valuations, longer lockups and more complicated fee structures. They will also reduce total portfolio liquidity over short- to medium-term time horizons.
Transparency can also be a concern. Public pension boards are rightly cautious when they cannot see daily pricing or easily compare performance to a simple public market benchmark. Fees may be another concern. Private equity, hedge funds and real estate strategies often carry higher headline fees than public market strategies and pension boards may be skeptical that the additional cost is justified.
Access can also be a challenge. The best alternative investment managers can be difficult to reach, particularly for smaller plans that may not have the scale to secure capacity, negotiate favorable terms or build diversified portfolios across vintages, sectors and managers. The dispersion of returns across managers in alternative investments is typically higher than it is in public markets, making manager research and access more important. For a public pension board with limited staff support, these obstacles can feel significant.
Those concerns are real, but they shouldn't become permanent barriers to a more effective investment program. For example, liquidity may be a common concern, but for a public plan with a long-time horizon, the liquidity needed to pay annual benefit payments is relatively small, usually between 5% and 10% of total assets. This actually could make public pension plans an ideal candidate for less liquid assets.
Moreover, fees tend to be higher for alternative investments, but these fees may be justified by the return and diversification the portfolio receives.
The implementation model matters
Larger public plans often have dedicated internal investment staff. They can perform manager due diligence, negotiate terms, monitor exposures and build multi-year commitment pacing plans. Smaller plans usually do not have that infrastructure, and in many cases, it would not be cost-effective to build it internally.
This is where the outsourced chief investment officer (OCIO) model can be especially useful. A strong OCIO provider can help smaller plans access institutional-quality alternative investments, evaluate managers, manage liquidity, negotiate fees, monitor risk, and integrate alternatives into the broader asset allocation. Just as importantly, an OCIO can help translate complexity into clear board-level decision-making.
The goal is not to make smaller plans look exactly like the largest plans. Scale still matters, and governance structures differ, but best-in-class OCIO providers can narrow the implementation gap. They can help smaller plans benefit from institutional portfolio construction without requiring the plan to hire a large internal investment team.
For public pension boards, this can be an important fiduciary advantage. The board can focus on objectives, risk tolerance, funded status and policy decisions, while relying on a professional implementation partner to manage the operational details.
Learning from larger plans
The data suggest that larger public plans have moved further into alternatives, and they have generally experienced stronger returns over the periods shown, even during significant drawdowns like in 2022. This does not prove that alternatives alone caused the return difference. Many factors influence performance, including public equity exposure, manager selection, rebalancing discipline and funding policy.
Still, the relationship is hard to ignore. Larger plans tend to have broader toolkits. They are more likely to invest in private assets and hedge funds. This creates more diversified portfolios that do not rely solely on traditional public markets.
The lesson for smaller public pension plans is not to chase returns or add complexity for their own sake. The lesson is to evaluate whether the current portfolio is using all reasonable tools available to improve long-term outcomes.
A thoughtfully designed alternatives program may help enhance returns, reduce volatility and improve the plan’s overall risk-adjusted profile. Over time, that can support funded status improvement and potentially reduce contribution burdens on taxpayers and employees.
Investor implications
Public pension boards do not need to become private markets experts overnight, but they do need to ask whether their portfolios are positioned to compete with larger peers that have already embraced a broader investment opportunity set.
For many smaller public plans, some of the historical barriers to alternatives—complexity, transparency, fees and access—are no longer as limiting as they once were. With a disciplined governance process and the right OCIO partner, these plans can build more diversified portfolios while maintaining appropriate oversight.
The largest plans have shown that alternatives can play a meaningful role in public pension portfolios. Smaller plans should not assume that opportunity is out of reach. The right question is not whether alternatives are too complex. The right question is whether the plan has the right partner and process to use them prudently.
iSource: Public Plans Data. 2024. Center for Retirement Research at Boston College, MissionSquare Research Institute, National Association of State Retirement Administrators, and the Government Finance Officers Association. Within this dataset for plans with less than $1 billion, the asset size ranges from $47 million to $979 million, with an average size of $518 million (n=31).
iiHere we define an allocation as having at 1% allocated to the asset class
iiiNote that the most recent available public data is as of the end of 2024, and the 3-year returns appear unusually low due to the impact of the drawdowns in 2022 in this period. Nearly every asset class lost ground that year.