

Executive summary:
- Geopolitical tensions and an uncertain inflation outlook rattled markets in the fourth quarter but U.S. stocks still managed to move higher
- While other equities lagged and bonds remained flat, investors who held a balanced portfolio once again did well
- As a new year and a new U.S. administration begins, it’s a good time to review client portfolios and prepare to navigate the road ahead
- Global diversification will become even more important as U.S. large cap valuations and dominance increase
You’ve likely heard the saying “when the going gets tough, the tough get going.” A similar principle can apply to investing: “when the going gets tough, stay in the market.”
It’s not a stretch to say that the going was pretty tough in the fourth quarter of 2024. Financial markets were volatile, and for good reason. There was a U.S. presidential election, won by Republican candidate Donald Trump, followed by U.S. policy uncertainty. There was the brief but worrisome threat of a government shutdown. The U.S. Federal Reserve cut rates as expected but then said it will be more cautious about further reductions, rattling the markets.
Despite this, the S&P 500 Index managed to deliver strong returns over the quarter, supported mainly by the big tech names that have outperformed over the past few years. But unlike the third quarter when every asset class rose, U.S. large cap stocks were the only winners in the period.
And since we all are aware that past performance doesn’t necessarily indicate future performance, that means anything can happen in the upcoming quarter – especially with so much geopolitical uncertainty.
Your clients may be excited or worried about the changes a new administration may bring, and they may want to alter their portfolio to reflect their outlook. But now, more than ever, it’s crucial to hold a long-term perspective and ensure your clients are diversified. Let’s look at where we are and what could come next.
As the past few quarters have shown, just buying what has worked recently doesn’t necessarily give a better return than a diversified portfolio. The chart below, which we used to introduce our Q4 Economic and Market Review, shows that a traditional 60% equity/40% fixed income balanced portfolio has served clients well over the years.
Since 1980 there have only been seven years in which a diversified portfolio didn’t deliver a positive return, and only two of those years have had negative returns greater than 10%. The only years where a diversified portfolio did poorly were 2008 as the Great Recession began and 2022, the worst year for bonds in history. I think we can all agree they are outliers.
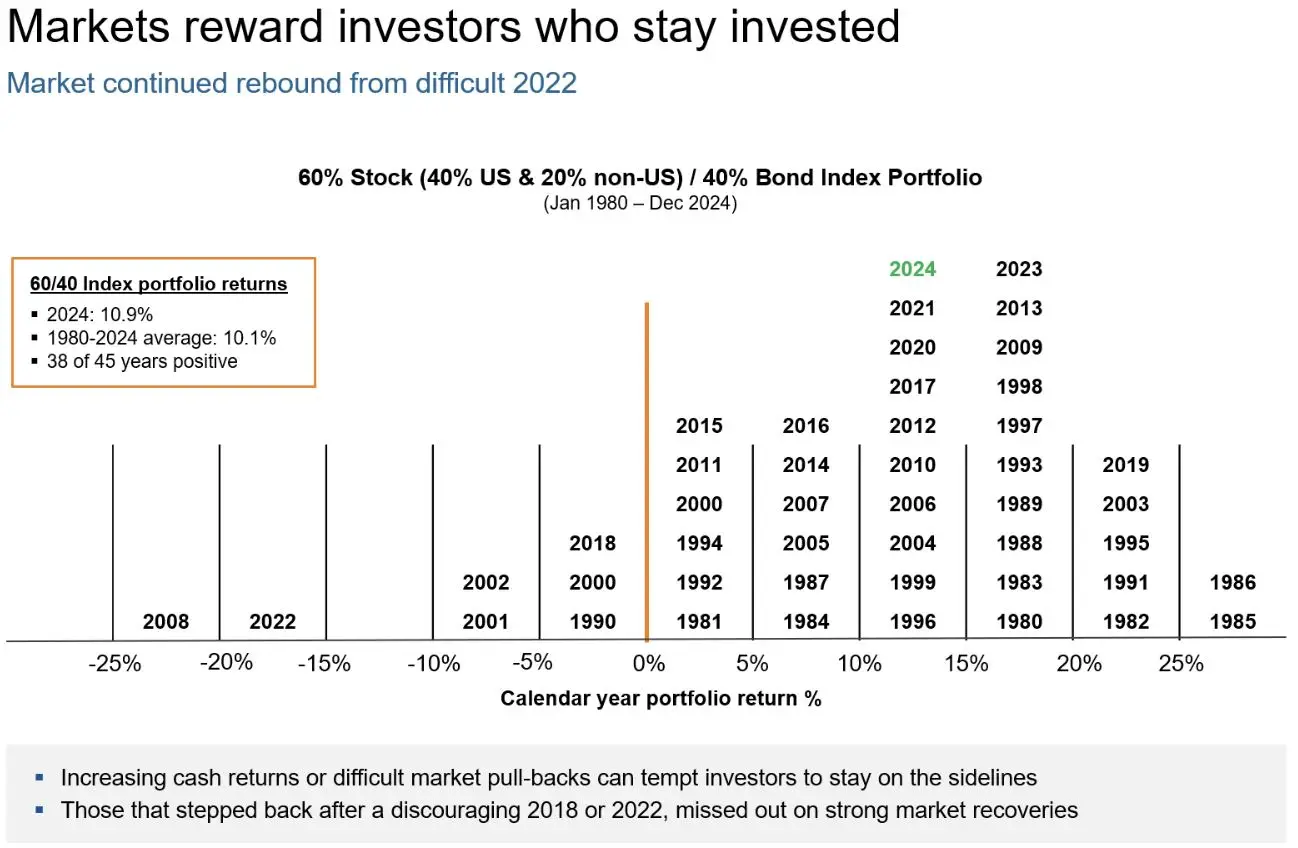
Index portfolio of 40% Russell 3000 Index, 20% MSCI EAFE Index, and 40% Bloomberg US Gov/Corporate Bond Index. Index returns represent past performance, are not a guarantee of future performance, and are not indicative of any specific investment. Indexes are unmanaged and cannot be invested in directly.
Why we believe global diversification matters
The continued dominance of those big U.S. technology names also shows the importance of diversification, especially global diversification. As you can see from the chart below, U.S. equity is commanding a bigger piece of world equities, with only FOUR names now representing one-fifth of the global stock market pie. Any single one of the big tech stocks – Apple, Nvidia, Amazon and Microsoft – have a higher market capitalization than Japan, the UK, France or Canada. To put this in perspective, those countries are members of the G-7 – the world’s most prominent developed economies. Apple has the same market capitalization as Japan, the world’s third-largest economy.
This U.S dominance and more importantly, concentration in only a handful of stocks, means that investors who aren’t globally diversified are vulnerable to any sudden or significant downturn in the outlook for technology stocks. A quick look back at what happened in 2022 may serve as a reminder.
From what I can see, the risk of a downturn isn’t zero. Let’s look at the price-to-earnings ratio shown at the bottom of the slide. It’s pretty evident how expensive those tech names are getting. In addition to cheaper valuations, non-U.S. stocks tend to provide larger dividends and serve as a currency hedge in the case of a weaker U.S. dollar. All I can say is: the rubber band is getting stretched.
What concerns me and I think should concern you is that when money starts to go out of the market, it’s most likely going to go out of those big technology names.
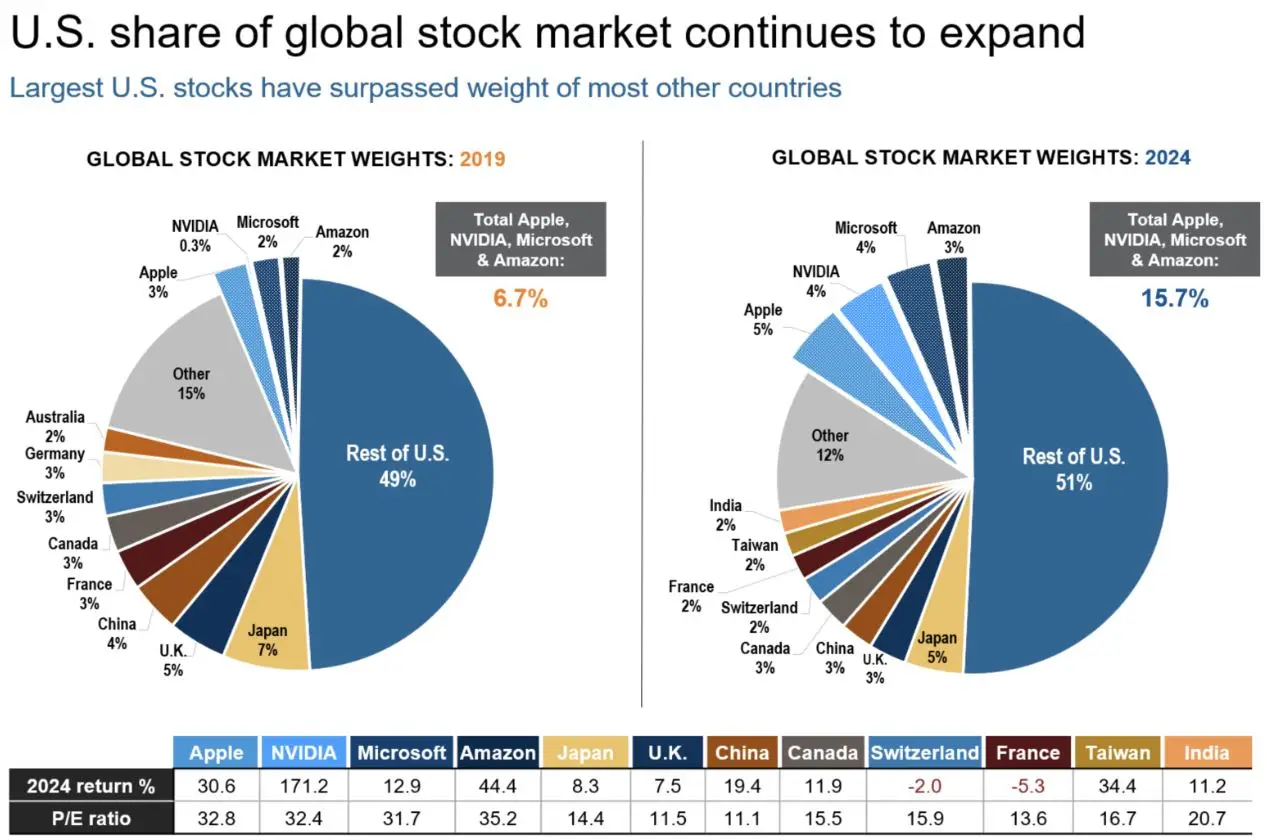
Source: Morningstar, Russell Investments and MSCI. Global Stock Weights represented by MSCI ACWI Index. Data as of each year end. Countries represent MSCI Indexes. P/E indicates Forward P/E ratio. Index returns represent past performance, are not a guarantee of future performance, and are not indicative of any specific investment.
Bonds are back better!
Now let’s look at the flip side of equities: bonds. Fixed income has been trying hard to regain its reputation as a balanced portfolio’s kinder and gentler member after a dismal 2022.
Bonds were relatively flat in 2024. With the 10-year U.S. Treasury yield at 4.9% at the end of last year, the most likely direction for yields is to go down. While bonds have underperformed in recent months, as the new year goes on and the U.S. Federal Reserve likely lower rates in the back half of 2025, the environment for fixed income returns will likely improve. If so, bonds could provide the equity offset that has traditionally been their role. In the meantime, if interest rates do increase, as the chart below shows, the yield an investor receives serves as an offset to the price decline from the rising rates.
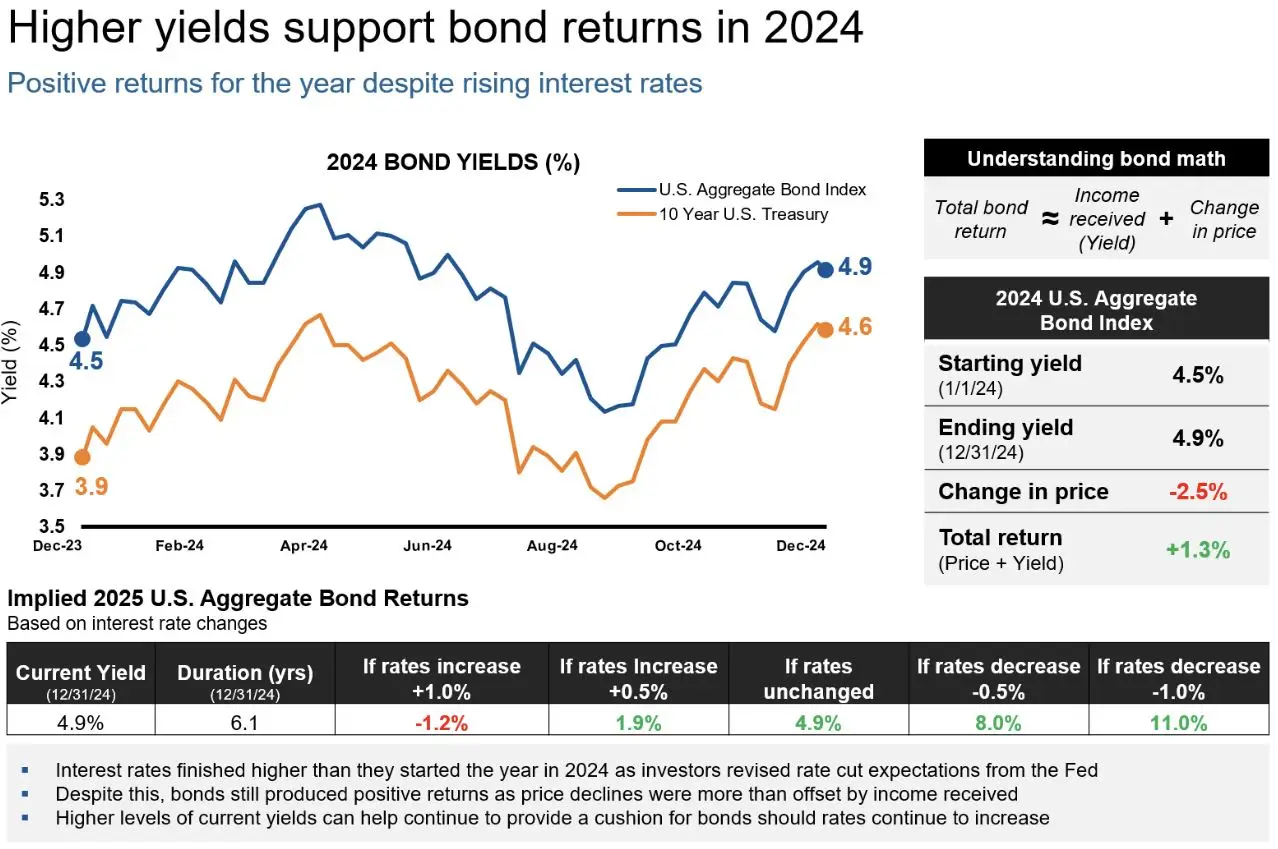
Source: Morningstar, Barclays Live and St. Louis Fed. U.S. Aggregate Bond Index represents Bloomberg U.S. Aggregate Bond Index. Index returns represent past performance, are not a guarantee of future performance, and are not indicative of any specific investment.
What comes next?
We are on the cusp of a new era in U.S. politics and the potential for change is great. The new administration of President Donald Trump has a majority in both Congress and the Senate and the likelihood of pushing through its main policies is strong. But which policies they will focus on are still to be determined and how they are implemented may lead to different consequences.
As we transition from politicking to policy-making, the ultimate outcomes on the four policy watchpoints below will be key drivers of the market’s direction in 2025 and their impact on such areas as inflation and corporate earnings.
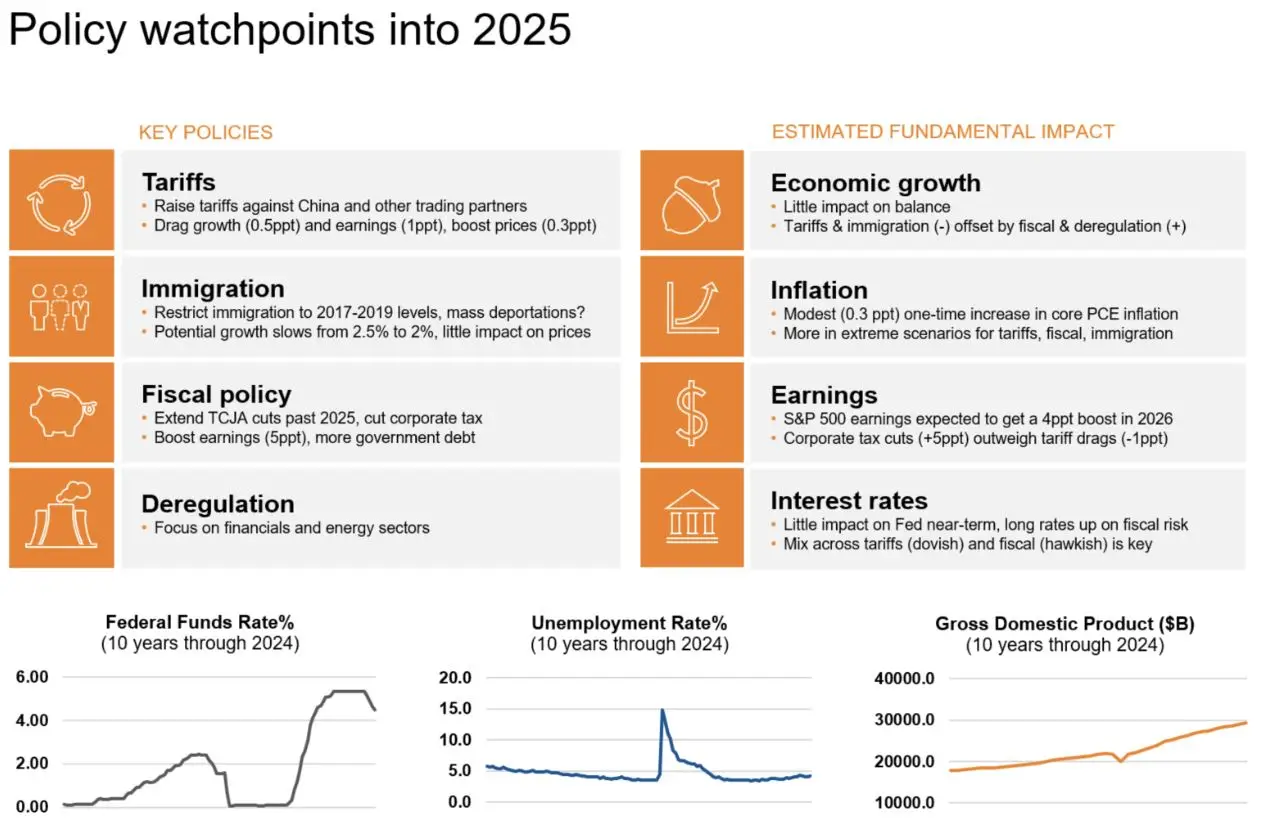
Source: Russell Investments, December 2024 and The St. Louis Federal Reserve (FRED)
The bottom line
It’s the start of a new year and a new U.S. administration so it’s a perfect time to review your clients’ portfolios.
Markets in 2025 will continue to focus on inflation, the labor market, earnings and overall valuation levels while digesting the outcomes of political policy decisions both in the U.S. and abroad. Maintaining a long-term perspective and broad diversification will be key to navigating the road ahead.