
Executive summary:
- Taxes on capital gain distributions are an annual reality for most investors.
- Distributions aren’t tied to market performance but to trading activity.
- Our review of estimated capital gains distributions shows that every asset class – even municipal bonds – will likely pay capital gains this year that will be subject to taxes.
- Investing with tax management in mind is key to building after-tax wealth
Every year, most investors face a near-certain reality: taxes on their investment portfolio. Those who invested in individual stocks will likely be taxed on the capital gains (as well as investment income) that were realized over the year. Those who invested in either mutual funds or exchange-traded funds (ETFs) will receive a tax bill on the distributions received, which often include capital gains.
And that is the reality of capital gains: they happen. In fact, they happen no matter what the markets do. First, let’s look at what the markets DID do: as of the first week of December, the S&P 500 Index is up for the year by almost 30%; the small-cap focused Russell 2000 Index is up more than 20%. International Developed and Emerging Markets indices are in positive territory for the year. That makes it likely that no matter how your clients are invested, capital gains will be a reality.
A History of Capital Gains
As you can see below in Chart 1, capital gains are distributed annually. In the “good years”, including this year, capital gains are to a degree expected by investors. They may not like it, but it makes sense to them that if their portfolio goes up Uncle Sam will want to take his share. The thing is, when markets are down, capital gain distributions still happen. That’s because capital gains aren’t necessarily tied to the market’s performance, but to activity within the portfolio. In 2008, 2018, and 2022, capital gain distributions were still hefty even though investors may have fallen behind on their investment growth.
Chart 1:
(Click image to enlarge)

Source: Morningstar Direct, as of November 30, 2024. U.S. Stocks: Russell 3000® Index. U.S. equity funds: Morningstar broad category ‘U.S. Equity’ which includes mutual funds and ETFs (and multiple share classes). For years 2001 through 2020 % = calendar year cap gain distribution ÷ year-end NAV, 2021 through 2023 % = total cap gain distribution ÷ respective pre-distribution NAV. For years 2001 through 2013, used oldest share class. 2014 forward includes all share classes. Indexes are unmanaged and cannot be invested in directly. Returns represent past performance, are not a guarantee of future performance, and are not indicative of any specific investment.
2024 – US Large, Mid, and Small
To help you prepare for what might happen this year, we start compiling data in early fall on what most of the fund industry is expecting when it comes to year-end capital gain distributions. These are generally estimates, with final numbers not known until the actual distributions are announced and made, usually between the second week of December and the end of the year. We update this estimate data frequently, and by the end of November we have a pretty good idea of what investors can expect.
In Chart 2 below, you will see a summary of distribution estimates for the major U.S. Equity asset classes. Overall, U.S .Large Cap Funds are expected to have an average distribution of just over 7% as a percentage of Net Asset Value (NAV). This is moderately larger than the long-term average. Since U.S. Large Cap stocks have posted returns above 20% for the past two years, one might have expected a bigger distribution But volatility has been modest, which puts a lid on some the trading activity that has the tendency to generate larger capital gain distributions. Still, a 7% distribution at a 20% tax rate works out to be 1.4% of the portfolio’s value that needs to be paid to the Internal Revenue Service!
Within the overall U.S. Equities space, growth-oriented stocks have the larger expected average distributions, at nearly 8% of NAV. U.S. Value stocks and Mid-Cap stocks are not too far behind, both with an expected average distribution rate of nearly 7%. Rounding out US equities, small cap equities are expecting to have a distribution rate that falls between 6-7%.
Chart 2:
(Click image to enlarge)

Source: Russell Investments and Morningstar Direct, as of 12/3/2024*. Categories based on Morningstar Category Group which includes mutual funds and ETFs (and multiple share classes). The average capital gain distribution % is calculated using the total capital gain distribution and respective pre distribution NAV as reported by Morningstar. % of NAV is calculated as (total capital gain distributions ÷ respective pre distribution NAV).
Chart 3 delves a little deeper and shows that growth stocks in both the Large and Mid-Cap segments have the biggest expected capital gain distributions. The story is a little different in Small Cap, where Small Cap Value Funds have a higher expected average distribution rate than Small Cap Growth Funds (7.1% vs 6.8%). Blend Funds, which investors sometimes refer to as Core, have lower expected distributions than their Style compatriots.
Chart 3:
(Click image to enlarge)

Source: Russell Investments and Morningstar Direct, as of 12/3/2024*. Categories based on Morningstar Category Group which includes mutual funds and ETFs (and multiple share classes). The average capital gain distribution % is calculated using the total capital gain distribution and respective pre distribution NAV as reported by Morningstar. % of NAV is calculated as (total capital gain distributions ÷ respective pre distribution NAV).
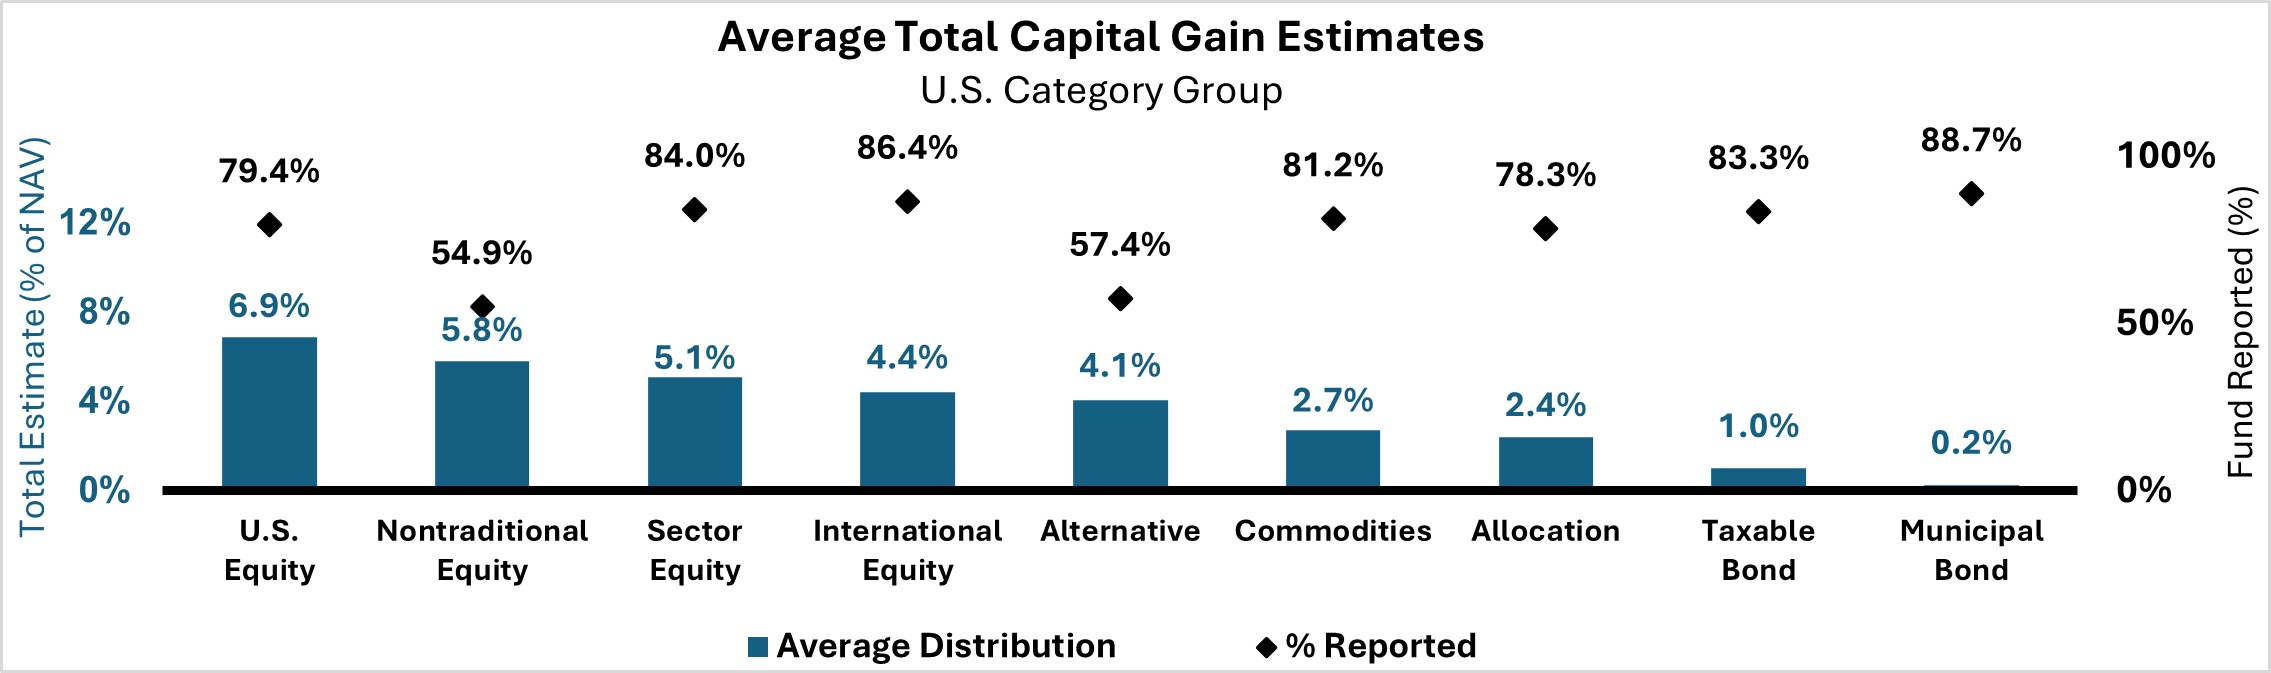
And finally, Chart 4 looks at the full spectrum of asset classes including Fixed Income. Fixed Income funds are typically at the lower end of the distribution range. There is a 1% expected capital gain distribution in Taxable Bond funds, and a greater than zero distribution rate for Tax Free Municipal Bond funds. Since 2022 was an anomalous year as Fixed Income had negative returns, it’s honestly a bit surprising to see Fixed Income funds with capital gain distributions in 2023, especially in the generally lower-tax municipal space. This is why tax management should be a very important consideration when you build an investment portfolio for non-qualified investors.
Chart 4:
(Click image to enlarge)
Source: Russell Investments and Morningstar Direct, as of 12/3/2024*. Categories based on Morningstar Category Group which includes mutual funds and ETFs (and multiple share classes). The average capital gain distribution % is calculated using the total capital gain distribution and respective pre distribution NAV as reported by Morningstar. % of NAV is calculated as (total capital gain distributions ÷ respective pre distribution NAV).
Investor and Advisor Action Steps
What can you do about the capital gain distributions that are expected?
Our top suggestion is to stop investing the distributions back into the portfolios they are coming from, especially if the tax bill is unwanted. Why reinvest back into the source of the problem? Instead, redirect the distributions towards a solution that is better suited for the investor’s non-qualified account needs. After-tax wealth growth should be a key priority in for investors who hold non-qualified assets. One of the best ways to accomplish that is to minimize the tax burden, year in and year out.
The bottom line
When it comes to average capital gain distributions, some distributions are higher, some are close to the average and some are lower. But the main take away for 2024 is that the average was HIGH! At Russell Investments, when it comes to capital gains distributions, our goal is not just to come in below average, but closer to zero.
So, faced with such robust capital gains distributions this year, how can you prepare for potentially difficult conversations with your clients? The 1099-DIV tax form can give you insight into the tax efficiency of your clients’ portfolios. It may make sense to transition all (or part) of a portfolio to a more tax-managed approach. Reach out to your Russell Investments representative to find out more about how tax-managed investing can help reduce the impact of taxes on investments.
*Calculated as of 12/3/2024, from publicly available data through Morningstar and formal fund company announcements. All information should be considered an estimate and subject to change prior to the payment date, any information released after this date is not considered. Total number of funds expected to make a distribution is based on the funds that formally announced capital gains estimates. The calculation excludes funds that are not expected to make a distribution.