Quarterly Trading Report – Q2 2023: A tale of two different responses to the debt-ceiling saga
Executive summary:
- Equity and fixed income markets experienced heightened volatility amid the Q2 debt-ceiling saga, while currency and derivatives markets were mostly unaffected.
- Regional banks struggled in Q2, with deposits and witnessed credit spreads widening by 100-200 bps to all-time highs.
- The U.S. dollar defied expectations and remained resilient throughout the second quarter, even during the teeth of the debt-ceiling crisis.
Fears that the U.S. government could default on its bills for the first time in history rippled through equity and fixed income markets during the first two months of the quarter, while foreign exchange and derivates markets escaped the drama largely unscathed. After Congress reached a deal to lift the nation's borrowing limit in early June, however, a wave of calmness spread across most asset classes—with the notable exception of some areas of the fixed income market, particularly regional banks.
At Russell Investments, our experience executing trades for a broad swath of clients affords us unique and valuable insights into the latest market trends. We trade over $2.2 trillion annually through our multi-venue trading platform and maintain a 24-hour trading desk with access to over 100 countries globally. Our trading desk covers all asset classes, including equity, fixed income, foreign exchange, and derivatives. Here are our key observations from the second quarter of 2023.
Equities
When debt-ceiling discussions began in the U.S. Congress in early February of this year, the equity Volatility Index (VIX) remained stable, and volumes in equity markets aligned with expectations. However, when it appeared that discussions between the White House and Republican party leaders were starting to fall apart in mid-March, the VIX shot up by over 30%, signaling an expected, potentially drawn-out negotiation process. This, in turn, sparked a spike in volume and a broad selloff in equity markets.
As the second quarter progressed, both the House of Representatives and the Biden administration continued to work through key differences, striking a deal right before the early June deadline when the U.S. government would have run out of money to pay its bills. Interestingly, the eleventh-hour agreement marked a near repeat of how a similar saga played out in 2011. In the wake of the early June deal, equity markets returned to a more normal trading pattern, with the VIX stabilizing and the broad equity indexes moving higher.
Fixed Income
Similar to equities, fixed income markets were driven by debt-ceiling news over the second quarter. The 1, 3, and 6-month issuances of the U.S. Treasury yield curve experienced the most volatility, steepening significantly as investors dumped short-term bonds over fears of a potential government default. The longer end of the curve saw less dramatic rate increases, with the 10-year yield rising by 30 basis points (bps) to a peak of 3.82%, while the 30-year yield climbed 20 bps, touching 4% at the peak. Notably, Treasury bill supply jumped after the debt-ceiling saga ended in early June, and this flood of issuance is expected to continue through the third quarter. Treasury auctions also saw an increase in supply in May for longer-dated issuances.
(Click image to enlarge)
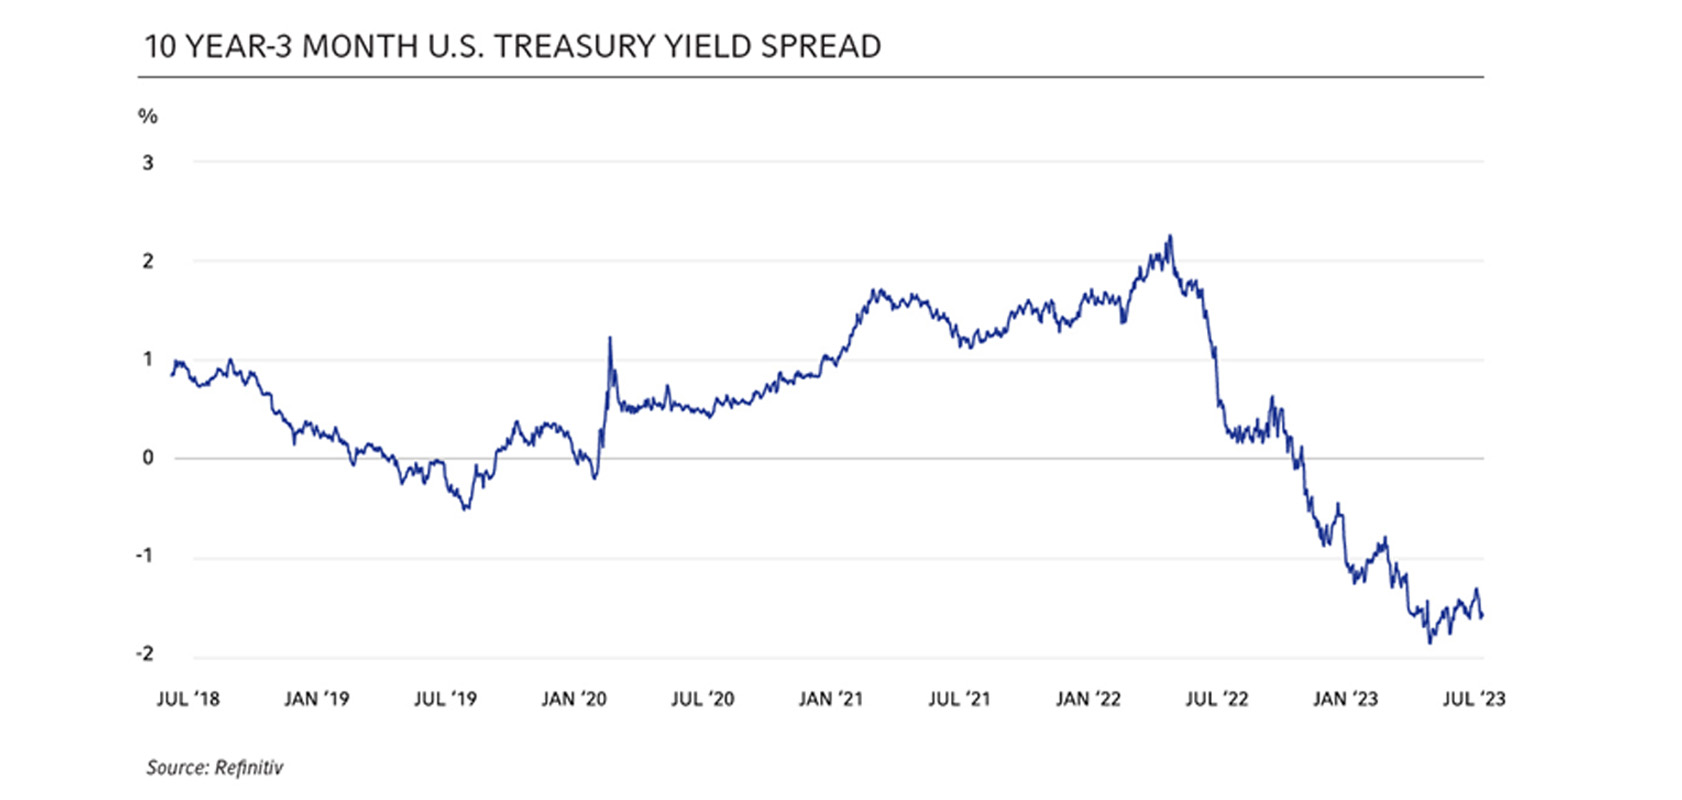
Investment grade credit continued tightening, moving 20-35 bps tighter over the second quarter. High-grade credits continued outperforming many market sectors, with continuous inflows due to a flight to safety. Meanwhile, regional banks struggled in Q2, with deposits and witnessed credit spreads widening by 100-200 bps to all-time highs. While government intervention has assuaged some concerns, the financial sub-sector remains the widest market sector at +210 OAS (option-adjusted spread), resting well above normal conditions.
Other key highlights:
- Health care and TMT (technology, media, and telecom) were among the lowest-cost sectors to trade.
- Investment grade financial and consumer non-cyclical sectors led new issuance and had a particularly strong May and June, up 49% versus the same period in 2022.
- EMD (emerging market debt) and HY (high yield) had continued outflows due to volatility and risk.
Foreign Exchange
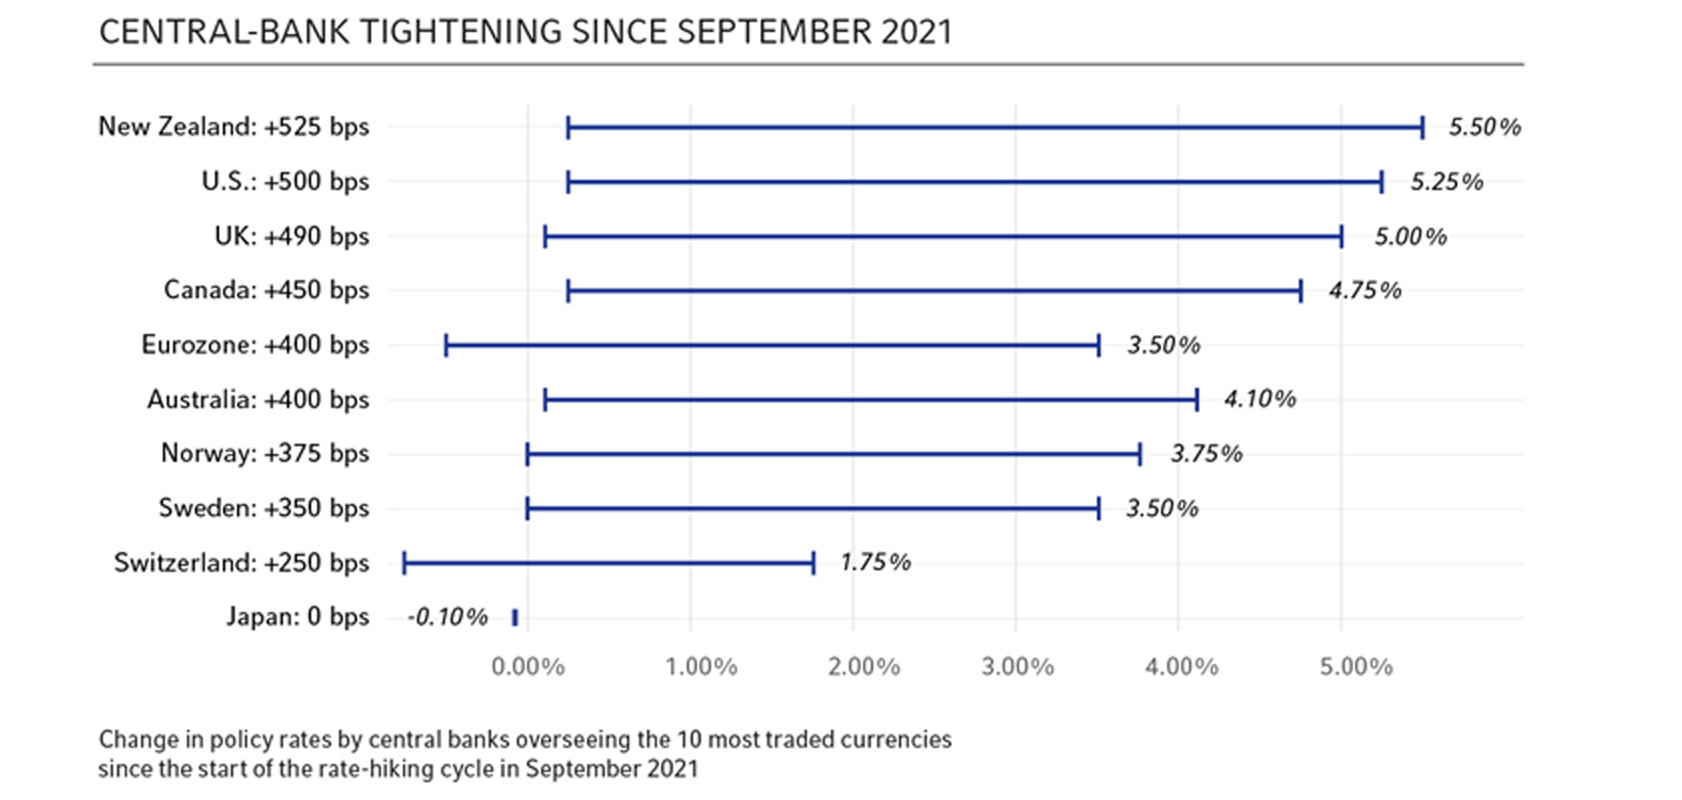
Although volatility was expected in currency markets due to worries over the U.S. debt-ceiling standoff in Congress, such instability failed to materialize, unlike in equities and fixed income. Heading into 2023, expectations were for the U.S. dollar (USD) and other currencies with strong linkages to the United States—such as the Canadian dollar (CAD) and the Mexican peso (MXN)—to weaken and money to pile into safe-haven currencies like the Swiss franc (CHF) and the Japanese yen (JPY).
Instead, the USD showed strength after the debt ceiling was reached in mid-January, and the Treasury Department was forced to take extraordinary measures to continue paying the government's bills, with the greenback even continuing to strengthen throughout February. Even as the stalemate intensified during the second quarter—particularly during May—the USD remained relatively resilient, with market participants focusing more on what actions key global central banks were anticipated to take next. Implied volatility continued to decline during this period, which again did not correlate with the risk posed had Congress failed to reach an agreement on the debt ceiling.
(Click image to enlarge)
Derivatives Trading
Like foreign exchange markets, the debt-ceiling angst scarcely materialized in derivates markets in the build-up to the late May/early June deal. As the saga faded into the rearview mirror in June, the markets quickly forgot the white-knuckle ride toward the end of the debt-ceiling road. Case-in-point: After swerving to avoid disaster, the S&P 500 Index posted a gain of 6.5% in June.
Other key highlights:
- According to the CFTC Commitment of Traders report that tracks asset manager utilization of listed futures, there was significant demand in June for equity futures.
- The buy side was net long U.S. equity index futures for June, marking a significant tilt.
- Roll cycles were choppy for benchmark U.S. Treasury futures, as their roll period coincided with the height of the debt-ceiling debate.
The bottom line
Every political and macroeconomic event is different, and so is the reaction across key asset classes. Last quarter's debt-ceiling crisis illustrates this fact all too well, with volatility permeating equity and fixed income markets. In contrast, foreign exchange and derivatives markets defied consensus expectations and made it through the teeth of the impasse with little in the way of turbulence.
For investors, we believe this unpredictability of markets underscores the need for 'round-the-clock access to a global trading desk that can execute trades anytime, anywhere. Likewise, we also think it's imperative to work with a trading provider with extensive experience in up-and-down markets and substantial buying and selling power.
At Russell Investments, we're dedicated to delivering scalable solutions that meet the trading and execution needs of asset owners and asset managers alike. We're also committed to sharing our insights and observations from our global trading desk with you every quarter. Please reach out if you have any questions.
Download complete report