Not That '70s Show: Why today’s inflation pales in comparison to the past
I was barely a toddler the last time inflation was as threatening as today. Moreover, if you are not a centenarian, this is your first pandemic. It's safe to say, then, that these are unprecedented times, and a playbook doesn't exist.
Inflation hits 40-year high
What’s been most incredible about the pandemic is not that it caused the deepest recession since the Great Depression, but the speed at which the U.S. economy recovered and the ensuing inflation. A 7.5% inflation rate would have been inconceivable in March 2020, the height of the COVID-19 panic. Nonetheless, due to the remarkable speed at which vaccines were developed and the heroic fiscal stimulus dispensed to prevent another Great Depression, consumer demand surged as pandemic-lockdowns eased. The collateral damage, however, were global supply chains. They were severely disrupted and slow to respond to the demand, contributing to the multi-decade highs in U.S. inflation, as shown in Chart 1.
Chart 1

Source: Refinitiv DataStream, Russell Investments. As of 4Q 2021.
The Fed turns hawkish
With inflation now at a 40-year high, all eyes have been transfixed on the U.S. Federal Reserve (the Fed). The consensus narrative has turned decidedly hawkish. A growing chorus of market pundits are calling for aggressive rate hikes to control inflation, with some arguing for up to seven 25 basis points rate hikes in 20221. Incredibly, just less than three months ago, the markets were busy assessing who President Biden would nominate as the next chairman of the FOMC (Federal Open Market Committee). Would Jerome Powell be re-elected, or, possibly, would the president go with someone perceived as more dovish instead2? Powell, of course, was renominated, yet the market narrative has drastically changed since then.
How does today’s inflation stack up against the 1970s and early 1980s?
A dovish Fed is now out of the question, and, instead, financial media has been busy analogizing today's inflation with the 1970s and 1980s. While the comparison is instructive, it's not ideal. Today's inflation is unlike the runaway price levels back then. Admittedly, the post-pandemic price surge has been uncomfortably sharp, but we don't believe it will be as persistent nor attain the peak levels reached in 1980, as seen in Chart 1.
Why? For starters, domestic and global economic fundamentals were very different in the 70s and 80s, making conditions more fertile for high and rising inflation.
How does global trade impact inflation?
To start, Chart 2 shows that the rise in international trade from 25% of global GDP (gross domestic product) during the early 1970s to around a 55% average over the recent five-year period has coincided with falling inflation. While global trade may not expand significantly from here, it's equally unlikely to revert toward the levels that persisted during the 1970s. Therefore, global trade may be a powerful headwind to higher inflation in the future.

Source: Refinitiv DataStream, Russell Investments. Annual data as of 2020.
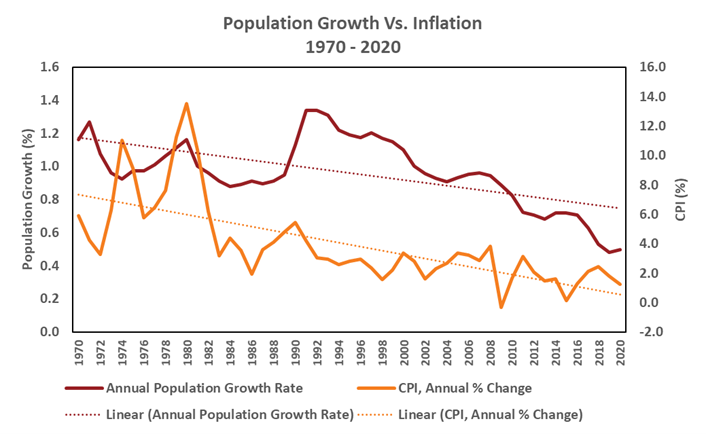
The relationship between population growth and inflation
Another differentiating factor is population growth. Keeping it simple, more people correlates with more demand, which, in turn, can set the conditions for higher inflation. As Chart 3 shows, U.S. population growth today is about half the rate it was during the 70s and 80s, declining from around 1% to 0.5%. Inflation, not coincidently, also trended lower over this period. A significant change in the birth rate or immigration policy will be necessary to reverse this trend, both of which seem even less probable today. The birth rate fell during the pandemic, and net immigration flows plunged during President Trump's years in office and hasn't recovered since—collectively worsening the longer-term demographic trend.
Chart 3
Source: Refinitiv DataStream, Russell Investments. Annual data as of 2020.
Do less powerful unions lead to less inflation?
Moreover, as union representation has declined since the 70s, organized labor's bargaining power has also diminished. As Chart 4 shows, wage growth was more robust during the 70s and 80s, averaging close to 6%. However, as the clout of unions declined, wages have struggled to sustain a growth rate significantly above 4% over the last three decades, averaging about 3%, or roughly half the rate that existed during the inflationary decades preceding it. Therefore, the post-pandemic wage spike, which is clearly at threatening levels, seems like an anomaly rather than the start of a new directional trend. The key takeaway is that marginalized union representation means wages are no longer indexed to inflation to the degree they were in the past, reducing the risk of a price-wage spiral.
Has the rise of tech dampened inflationary pressures?
Technology has also been central to the disinflation trend. Technological advances have boosted productivity, and this has had a dampening effect on inflation. Moreover, since the pandemic, businesses have embraced automation due to labor constraints impeding production—yet another setback for sustained wage growth.
Chart 4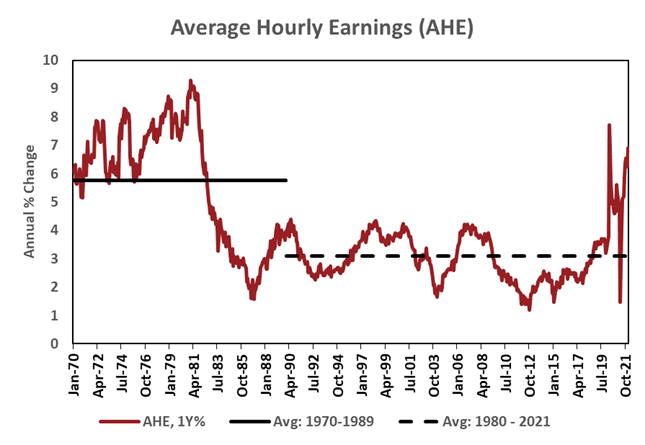
Source: Refinitiv DataStream, Russell Investments. Monthly data as of January 2022.
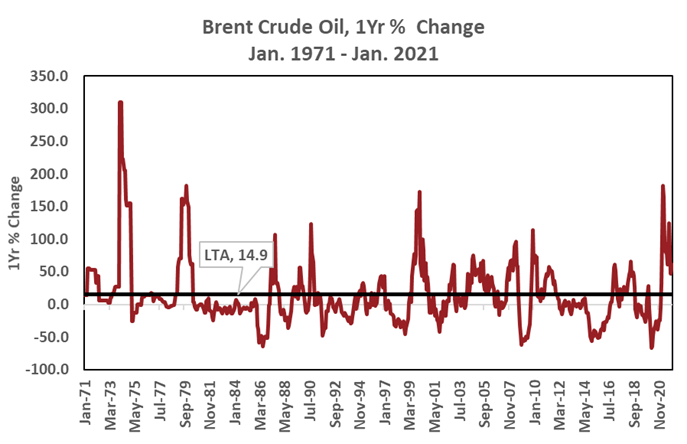
Today’s surge in oil prices: Nothing like the '70s
Finally, the story wouldn't be complete without acknowledging the role of oil prices. Geopolitical tensions contributed to dual-energy shocks, in 1974 and 1979, with yearly changes in oil prices rising by over 300% and 180%, respectively, just five years apart. And although oil prices have surged today from their pandemic lows, as Chart 5 shows, oil prices have risen by similar magnitudes in the past—and the current surge pales in comparison to the dramatic rise seen in 1974.
Chart 5
Source: Refinitiv DataStream, Russell Investments. Monthly data as of January 2022.
How does federal spending today compare to the 1960s?
While structural trends suggest that a sustained period of higher inflation and a wage-price spiral is less likely today than during the 70s and 80s, there are cyclical similarities that could support higher inflation, at least over the short term. The most notable similarity is federal spending, which rose during the 1960s, as it did so during the COVID-19 recession.
President Lydon B. Johnson's "Great Society" domestic initiatives and the Vietnam War boosted spending and set the conditions for rising inflation. However, as inflation started to advance during the mid-1960s and 1970s, the Fed did not sufficiently tighten monetary policy to restrain price increases and did fall behind the inflation curve. Moreover, monetary policy broadly was more expansionary before Paul Volker become the chairman of the Federal Reserve in 1979.
Assessing the suitability of prior Fed policy
In Chart 6, we measure the suitability of Fed policy by taking the difference between the fed funds rate and nominal GDP. The lower the line, the less restrictive the policy rate was relative to nominal GDP growth. From 1954 to 1978, the federal funds rate was, on average, 3% below nominal GDP, while during the period after inflation was broken—from 1983 to 2019—it averaged 1.3% below nominal GDP. In other words, monetary policy was roughly twice as tight in the period after Volcker took down inflation versus the decades preceding it.
Chart 6

Source: Refinitiv DataStream, Russell Investments. Based on quarterly data as of 4Q 2019.
For comparison, Chart 6 shows how unapologetic Paul Volcker was when tackling high inflation. From the second quarter of 1979 to the third quarter of 1983, the Fed’s policy rate was on average about 3.4% above nominal GDP and got as high as 9% in 1982—a historically high level relative to any other point over the analyzed history.
Today's environment is vastly different, and we must acknowledge that the data is highly volatile, and the inflation outlook is very fluid. These conditions are distinctive, if not unprecedented, due to the nature of the recession and the policy response. As noted at the start, today's high inflation is due to a combination of historic fiscal stimulus supporting robust demand that could not be fulfilled due to broken supply chains. However, we believe many of these conditions will partially reverse over the next year.
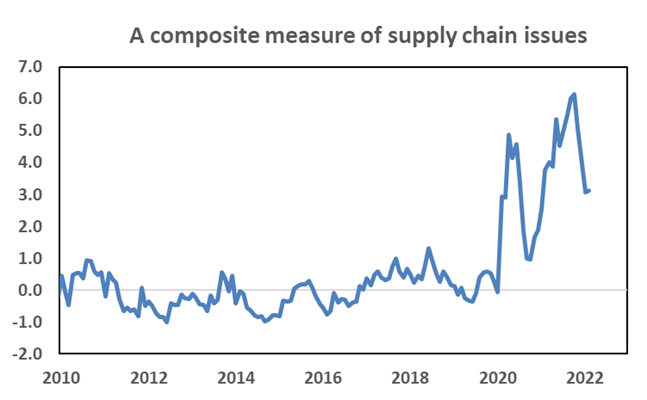
When could inflationary pressures start to ease?
Starting with fiscal stimulus, if there is any, it will be limited in 2022—and therefore households will need to depend on savings, income or debt, to support future demand. Additionally, as the economy more fully reopens, spending will rotate away from goods, where the demand had been concentrated, and toward services. While supply chains may take time to heal, gradual improvement is expected. Therefore, we believe inflation should moderate over the ensuing months. Anecdotally, a composite measure of supply chain pressure has eased from recent highs, as shown in Chart 7, which we see as an encouraging sign.
Chart 7
Source: Refinitiv DataStream, Russell Investments calculation. Monthly data as of February 2022.
Importantly, the Federal Reserve has communicated its intention to normalize policy and has already begun to wind down its asset purchase program, also known as quantitative easing, or, simply, QE. Rate hikes are projected to occur as soon as the March policy meeting, with the Fed expected to commence shrinking the size of its balance sheet—a policy known as quantitative tightening, or QT—shortly after that.
How much lag time could there be between policy changes and real-life impacts?
The tricky part is that the Fed will be normalizing policy just as inflation and GDP growth are expected to moderate throughout 2022. Keep in mind that monetary policy changes work with a lag. In other words, the economy will feel today's rate hikes in six to 12 months. Therefore, while it's easy to be critical of Fed policy and to suggest the central bank is behind the inflation curve, it's a delicate balancing act.
Importantly, both growth and inflation are expected to moderate, with market-based measures for inflation expectations based on the 5-year/5-year forward breakeven inflation rate well anchored at around 2%, as of Feb. 9, 2022. Just as important, the yield curve—which is the difference between the short-term and long-term Treasury yield—is flattening.
Therefore, the risks to aggressive rate hikes is that the yield curve could quickly invert and tighten financial conditions, which, historically, has been a prelude to a recession (as shown in Chart 8). The odds that the Fed would raise rates enough to provoke this outcome and risk secular stagnation—where the economy operates below its potential growth rate—seem unlikely, as this would be out of step with the Fed’s purpose.
Chart 8
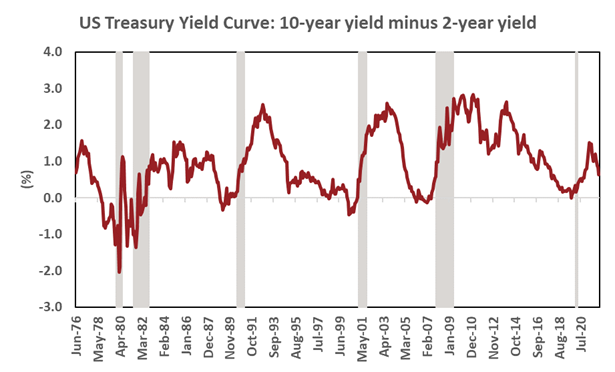
Source: Refinitiv DataStream, Russell Investments. Based on monthly data as of February 1, 2022.
The bottom line
The key takeaway is that today's environment is very different than 1970s-style inflation spiral. Although inflation is similar to levels dating back to the Volcker era, structural differences argue against persistent inflation. Moreover, as Chart 6 shows, the pre-Volcker Fed, on average, kept monetary policy more expansionary. The U.S. central bank was arguably slow to respond to the burgeoning inflation during the mid-60s and early 70s, which eventually accelerated due to the oil price shocks.
That approach stands in stark contrast to today, where the Fed has pivoted and is preparing the markets for policy normalization. Keep in mind that higher rates may lessen demand, but they are not designed to repair broken supply chains. Ultimately, it's worth noting that economic data—and not market pundits—will dictate the Federal Reserve’s actions moving forward. We’ll be paying close attention to the latest numbers and will update our clients accordingly.
1https://www.bloomberg.com/news/articles/2022-01-28/fed-could-hike-at-every-meeting-this-year-bank-of-america-says?sref=2I7V236A
2https://www.cnbc.com/2021/11/18/if-biden-picks-brainard-over-powell-for-fed-chief-expect-an-immediate-market-impact.html