$20 billion club strategy series – Investment policy
Executive summary:
- Investment policy is one of three major levers that plan sponsors can pull to impact the trajectory of their DB plans. It is used to instruct how plan sponsors want their plan assets allocated, and what objectives and constraints guide this decision.
- Over the past decade, the trend among the largest public U.S. DB plan sponsors is one toward de-risking plan assets, even when this will reduce the expected returns for the plan.
- We believe it's best practices for all DB plan sponsors to implement a glidepath in their investment policy statement.
The $20 billion club is a group of pension plans with more than $20 billion in global pension liability. We have been reporting on this group for the last 13 years, pointing out how and why its funded status has changed, and we have been reporting on how these sponsors' strategies for managing risk have evolved over time.
In the past, we have used the $20 billion club strategy updates to assess how these mega-plans adapted over the previous year. This time, we are putting together a series of articles to address the major levers that plan sponsors can pull to impact the trajectory of their large defined benefit (DB) plans. These three broad levers are often closely intertwined and pulling one lever can lead to adjusting another. The three key levers are:
- Investment policy - This lays out how those contributions go to work for the sponsor
- Benefits policy - This directly impacts plan participants' benefit accruals
- Funding policy - This determines the contributions made by the sponsor to pay for those benefits
Today we'll be delving into the plan investment policy within the $20 billion club and what has transpired in recent history. The investment policy is used to instruct how the plan sponsor wants its plan assets allocated and what objectives and constraints guide this decision. During the past decade, there has been an overall industry shift in asset allocation, from investing assets with a traditional asset-only focus to an asset-liability focus. This holds several important advantages to sponsors, such as decreased volatility in plan surplus (difference between assets and liabilities) year to year. We have discussed in the past how this trend has reared its head in the $20 billion club and, unsurprisingly, this has continued over the past few years.
Over the full strategy series, we'll get into some of the details on why plans might have started and continue to march down the de-risking path, but let's start with showing what we're talking about. Exhibit 1 illustrates the broad average asset allocation of the club1 for the period 2011 to 2022.
Click image to enlarge
Exhibit 1: Average actual asset allocation 2011-20222

Over the past decade, the average amount of fixed income assets has slowly been on the rise and equities have been on the decline. For many plans, this type of asset allocation move is typically the result of an increase in funded status and pre-planned through a glidepath. Due to how DB plan liabilities are measured, they behave in a very similar manner to fixed income assets. By increasing the amount of fixed income held by the plan, the assets will begin to behave more like liabilities. The more the assets behave like the liabilities, the less the surplus will fluctuate. Since 2011, the average amount of fixed income assets has increased by 17%. Moving from an asset allocation of 60/40 to 45/55 is not an insignificant move and illustrates a deliberate move toward assets that behave more like the liabilities.
In 2022, the de-risking trend continued, with target asset allocations decreasing equity allocations by about 3% on average, fixed income increasing by about 2% and other assets by about 1%. It is important to distinguish the difference in these targets from the actual allocations shown in Exhibit 1. Actual allocations are subject to market movement and these jumbo plans can fall victim to their size in how quickly actual allocations move toward targets. The target allocations give a good idea of the intended strategic asset allocation and tend to be stickier than actual allocations. A few notable moves in 2022 can be seen in Exhibit 2:
Exhibit 2: Notable target asset allocation activity in 20223
| 3M | Fixed income allocation increased by 10% |
| AT&T | Fixed income allocation increased by 5% |
| Dow | Fixed income allocation increased by 6% |
| General Electric | Fixed income allocation increased by 4% |
| Johnson & Johnson | Fixed income allocation increased by 3% |
| Merck | Fixed income allocation increased by 13% |
| Northrup Grumman | Fixed income allocation increased by 11% |
| Raytheon | Fixed income allocation increased by 10% |
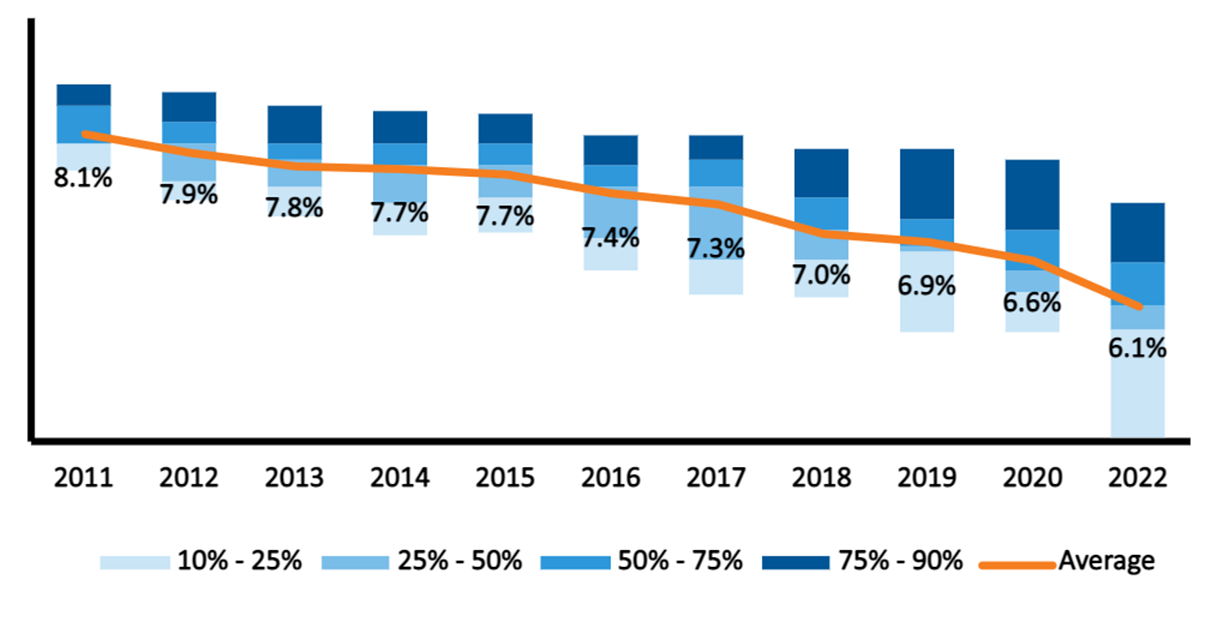
A key metric that is tied to the asset allocation and the investment policy is the expected long-term return on assets (ELTRA). In broad terms, the ELTRA assumption is useful only in the calculation of pension expense, which may be more or less important for a given company. Every $20 billion member has reduced its ELTRA assumption over the past decade, but some have done so more dramatically. Many companies have commented over the years on the decrease in ELTRA being associated with de-risking moves and increased fixed income allocations. Exhibit 3 illustrates this downward trend on the assumption over time.
In 2022, 11 companies lowered their ELTRA assumptions. While many of these decreased assumptions were smaller 20-30 basis-point declines, a few notable exceptions had larger declines. These included 3M and PG&E, which both decreased by 50bps, and UPS and Exxon, which decreased by 60bps and 70bps, respectively.
Click image to enlarge
Exhibit 3: ELTRA assumptions since 20114
What does this all mean for your DB plan?
One of the main goals of the $20 billion club has been to help plan sponsors understand how industry trends have been developing. Not all plans are created equal, and we focus on these largest plans because they have access to the most sophisticated service providers and the latest innovative strategies. They also tend to have experienced experts on staff who can focus a large portion of their time on their DB plans. Gathering and examining what these jumbo-sized plans have been implementing and adjusting, both reactively and proactively, helps not only to observe the current trends, but also to provide unique insight into where the industry may be heading.
As mentioned, the different levers available to plan sponsors are often intertwined and we'll get into the other levers over this series, but for the investment policy, the trend is clearly one toward de-risking plan assets, even when this will reduce the expected returns for the plan. This is in the face of funding regulations like the American Rescue Plan Act and Infrastructure Investment and Jobs Act that have provided plan sponsors the ability to take contributions holidays and potentially incentivize increasing risky assets in the plan.
At Russell Investments, for closed or frozen plans, we have a strong belief in a similar approach that the members of the $20 billion club have taken. This is one of the reasons we advocate for implementing a glidepath in the investment policy statement. As a plan approaches full funding, we view it as a good idea to lock in your wins by moving from growth-oriented to liability-hedging assets, which will ultimately reduce the plan's surplus volatility. When starting this transition, it can be even more impactful to use longer duration fixed income assets like treasury STRIPs, or even synthetic rate exposure through Treasury futures.
A note on $20 billion club membership
Over the last several years, inclusion in this group of mega plans could have increased a few times due to falling interest rates, which caused liabilities to soar. However, we have kept this group consistent to maintain a certain level of consistency. This past year was an exceptional year in many ways, but that has shone through in the DB plan space perhaps more keenly than many other areas. We have used this as an opportunity to refresh the membership of our $20 billion club. The most recent list of 20 companies can be found in our 2023 update many of which have long been members of the club.
1 Annual averages are based on the $20 billion club membership in the given year.
2 Based on 10-k filings. Based on the $20 billion club membership in the given year.
3 Based on 10-k filings.
4 Based on 10-k filings. Based on the $20 billion club membership in the given year.