Beyond borders: Why global diversification still matters (Part 1)
Remember that feeling as a kid when you had finished eating everything on your dinner plate--except for the vegetables? The peas. The broccoli. The Brussels sprouts were my personal arch nemesis as a child.
And your parents would coax you--ok, maybe force you--to eat your vegetables because "they're good for your body, they'll help you grow big and strong and make your brain faster... yada, yada, yada."
Yet no matter how reputedly good these vegetables were for my long-term health, they still didn't feel good at the time.
It turns out that that gut-wrenching, sinking feeling haunts us in our adult life, too, when it comes to investing. It's how it feels to buy stocks that have been doing poorly. We have that same internal tug of war in the investing part of our life as we do in the eating a balanced diet part of our life:
- Our brain reminds us that buying low and selling high and diversifying our portfolio are keys to long-term investment success.
- But our heart just wants what feels rewarding right now: an investment that is going up in value, that is shiny and sparkly and WINNING.
I find that the well-known rollercoasting of investing emotions illustration depicts those mood swings quite accurately.
This hypothetical example is for illustration only.
Well, today, the Brussels sprout equivalent for investors is virtually any non-U.S. stock. After all, as of October 31, 2018, U.S. stocks (S&P 500® Index) have beaten international developed stocks (MSCI EAFE Index) and emerging markets (MSCI Emerging Markets Index) for the quarter-to-date, year-to-date, 1-year, 3-year, 5-year and 10-year periods.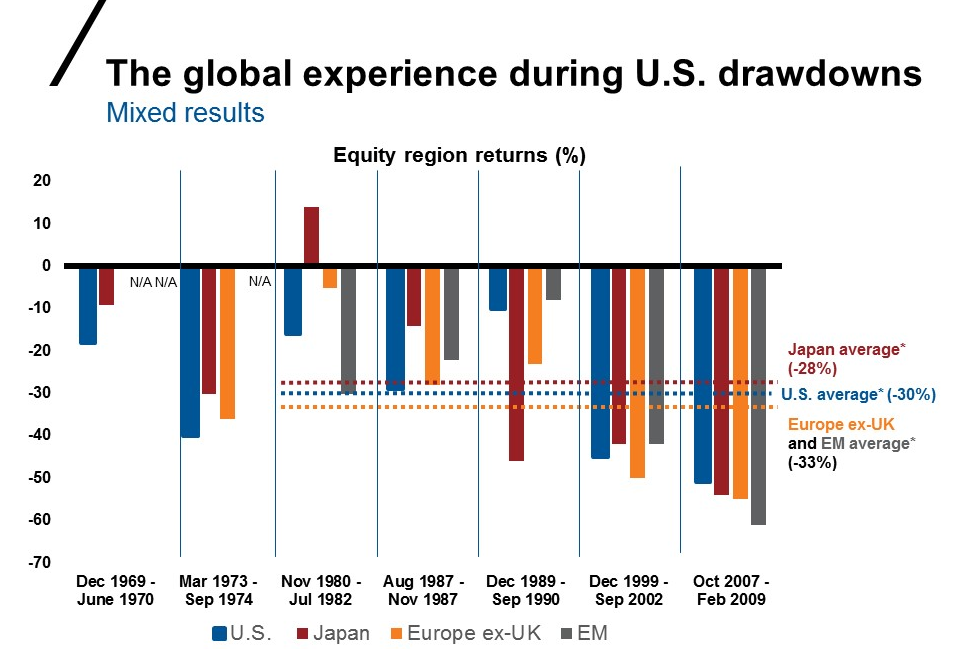
Source: FTSE/Russell, Bloomberg, MSCI and FTSE NAREIT. Index returns represent past performance, are not a guarantee of future performance, and are not indicative of any specific investment.
So, is now the time to hit pause on our heart-strings that are tempting us to buy more of those winning U.S. stocks, and instead follow our brain that's counseling us to pivot to non-U.S. stocks?
That's exactly what I sat down with my colleague Mark Eibel, Director of Client Investment Strategies, to talk about recently on the latest Russell Investments podcast.
Here's a recap of the first part of our conversation, which focuses on the likely causes of the current disparity between the U.S. and other markets, as well as the risks we see in U.S. equities going forward. We'll follow up with a summary of the second part of our conversation, which highlights the potential opportunities we see in places like Europe and Japan, in a subsequent blog post. As always, you can listen to the podcast for our complete conversation.
What's powered the U.S. bull market since 2008?
Eibel has a word for the difference in performance between the U.S. stock market and the rest of the world since 2008: Extraordinary. "From 2008 through Oct. 31, 2018, there's been a 6% annualized difference between the U.S. and the rest of the world. Put another way, every single year, for almost 10 years, the U.S. has outperformed the rest of the globe by about 6%."1
This isn't normal. Looking at the 40-plus year period from 1970-2007, U.S. markets were up 11.06%, compared to 10.86% in non-U.S. developed markets2--a wash, essentially. This is because levels of risk and volatility typically even out over the long run. Historically, recoveries in the U.S. stock market do tend to last a bit longer, which also means that when non-U.S. markets outperform, investors tend to get their returns back quicker in the short-term. This is one of the reasons why we consistently advocate a diversified portfolio, as we believe blending U.S. and non-U.S. markets can lead to a little bit better return at a lower risk level.
Given that long-term averages between the U.S. and other non-developed markets are equal, we think that the rest of the world is due to outperform America at some point--and it may only be a matter of time. After all, says Eibel, all good things come to an end--the U.S. bull market's extraordinary run included.
The great recession: The catalyst for U.S. outperformance?
What's led to the U.S.' reign at the top of today's bull market? For a greater understanding, it's helpful to look back at the events of 2008. The global financial crisis kicked off in the U.S., with the ramifications then spreading to the rest of the world. In this case, there was a silver lining to being first: the U.S. was able to pull itself out of the recession before other countries.
"If you cause a problem, you know it--and therefore, you're the first to remedy it," Eibel says. In this instance, the fix for the U.S. was dropping interest rates to zero, and pumping additional money into the system via quantitative easing. Not surprisingly, the U.S. was the first major economy to implement both of these measures, which led to roughly 2% economic growth in the following years. While such a number may not be show-stopping, the ensuing U.S. stock market performance certainly has been. Eibel believes some of this is attributable to the fact that because the U.S. was first in implementing a solution, U.S. markets were first to be rewarded. After all, as the old saying goes, the early bird gets the worm.
At this juncture last year, however, it appeared that the rest of the world was poised to catch up. After all, emerging markets led the pack in 2017 market performance, followed by non-U.S. developed markets in second place. The U.S. was only third.3 But then, the calendar flipped to 2018 and the U.S. kicked things into overdrive.
The anomaly of 2018: What's behind it?
"Normally, ten years into an economic recovery, you don't accelerate--you slow down," Eibel remarks. So, why the continued outperformance in U.S. equities this year? One overarching reason: Tax reform--and its impact on year-over-year comparisons.
During the second quarter of 2018, the U.S. economy grew at a 4.2% clip, when compared to the second quarter of 2017. Similarly, overall company earnings during the second quarter of this year were up approximately 20% in the U.S., when compared to the same period a year ago. "The impact of tax reform is definitely being reflected in the earnings and economic growth numbers for 2018," Eibel states, "but of course, it wasn't in the 2017 numbers, so it's a bit of an unfair, apples-to-oranges comparison."
While the quarterly economic and earnings numbers witnessed so far in 2018 are very strong, the forward-looking outlook appears much murkier. Sustainability is perhaps the biggest question mark--in part due to what we see as the latter innings of the current market cycle, but also because next year's comparables will be measured against this year's. What might this mean? Consider some preliminary numbers from Thomson Reuters, which predicts U.S. earnings to the tune of 10% in 2019. That's a good number, no matter how you slice it. Yet, such a figure would only amount to half the rate of growth seen during the second quarter of 2018. "If these numbers pan out, U.S. markets will likely see a slowdown in 2019," Eibel predicts.
Other concerns about the U.S.
In the U.S., valuations are also historically high, with cheaper prices everywhere else. While this doesn't mean the U.S. market can't grind higher from here, make no mistake: it's overvalued, says Eibel.

Data as of September 2018. Source: Datastream, MSCI Country and regional Indexes. Russell Investments calculations. Index returns represent past performance, are not a guarantee of future performance, and are not indicative of any specific investment. See appendix for ratio definitions.
There is, however, an argument to be made for the costliness of U.S. stocks--chiefly, the aforementioned 4.2% economic growth. In other words, perhaps equities are expensive because the U.S. is performing in such extraordinary fashion, lending credence to a pay-to-play line of thinking.
While this certainly has merits, the sustainability of U.S. growth moving forward is why, in Eibel's opinion, the better game is probably outside the U.S. "The way I see it, if I'm going to be paying more money for U.S. equities than I would for any other asset class in the world, the story has to be getting better," he says. "Otherwise, I'm going to go out and purchase a similar product at a cheaper price somewhere else."
Others appear to be in agreement. According to recently released data from the FUSE Research Network, three of the top six asset classes with the greatest expected allocation increases among advisors over the next 12 months are emerging markets, international core and global equities.4 In other words, non-U.S. equity strategies are surging to the forefront as a growing number of advisors lay plans for more globally-diversified portfolios.
Outside of questions around U.S. sustainability, we think another key reason for this is the risk to U.S. markets of rising interest rates, as the Fed appears committed to its cycle of quarterly interest-rate hikes. The central bank's actions seem prudent, notes Eibel, in order to keep inflation under control. This, however, presents more competition for stocks. "Bonds may start to look more attractive in a rising interest-rate environment," he remarks.
In addition, interest rates remain low outside of the U.S.--particularly in Europe and Japan. It's these areas in particular that Eibel believes make the global diversification story an attractive one. And to the extent that history rhymes, asset class leadership reversals tend to happen quickly--so unless you're positioned in advance to capitalize on the turning point, you're likely to miss it.
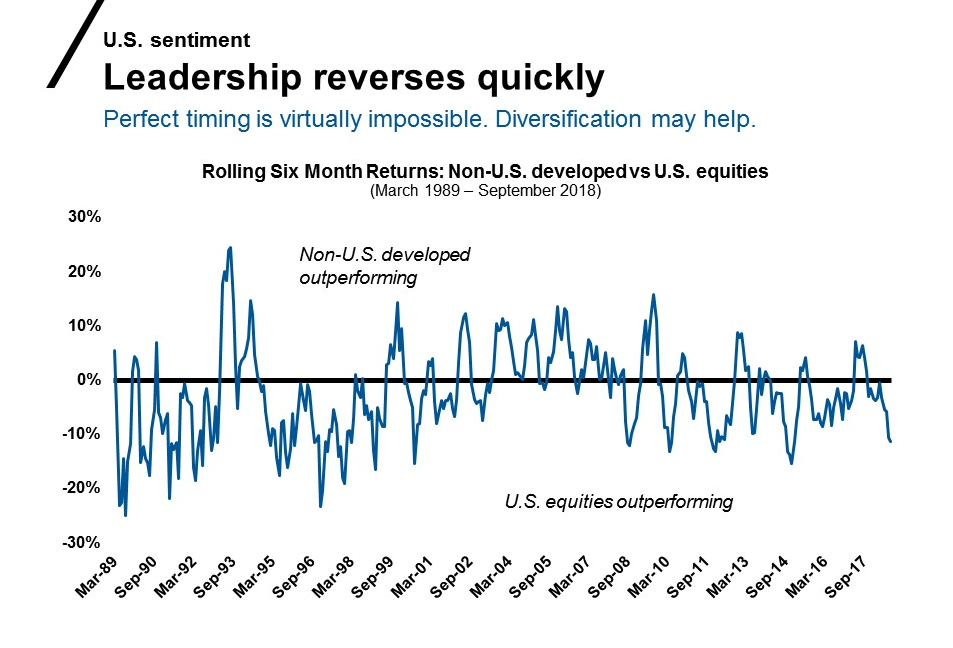
Source: Non-U.S. developed markets represented by MSCI EAFE Index. U.S. equities represented by S&P 500® Index.
In part 2, we'll dig deeper into why we believe these parts of the globe offer better potential. For now, though, suffice it to say we believe there are plenty of warning signs in the U.S. Looking beyond America's borders may well be the best way to offset some of this risk.
Don't want to wait for part 2? Listen to the complete podcast on global diversification today.
2 Source: S&P 500® Index, MSCI EAFE Index
3 Source: Emerging Markets represented by MSCI Emerging Markets Index had a calendar-year return of 37% in 2017. Non-U.S. developed markets represented by MSCI EAFE Index had a calendar-year return of 25% in 2017. U.S. Equity represented by Russell 3000® Index had a calendar-year return of 21% in 2017
4 Source: FUSE Research, November 7, 2018: Non-US Equity Strategies Feature Prominently in Advisor Allocation Plans for 2019.