Are your clients on track for retirement? Here’s a way to know where they stand.
What number do you use when discussing retirement with your clients? Do you talk about planning for 60% or 70% income replacement? Or a 4% withdrawal rate as a rule of thumb? Do you aim to have their portfolios sustain them until they are 90, or 95, or 100?
While those numbers may be important, they may not give your clients any certainty about their future. Planning for a target income level can be hijacked by an unexpected cost – such as a home repair or health issue. Using withdrawal rates as a guide doesn’t factor in market volatility. And as longevity increases, even aiming for 20 to 30 years of portfolio sustainability may not be enough.
There’s another number you can use to help your clients plan for a financially healthy retirement. It’s called the funded ratio. The funded ratio, which is expressed as a percentage, is the ratio of an investor’s total estimated assets to their total estimated liabilities.
Ideally, your clients will have a funded ratio above 100% by the time they retire. That means they are on track to meet their retirement goals and gives them a margin of security. Your clients who are projected to have a funded ratio below 100% will need to revise their retirement plans – which is where you, the advisor, can help.
Funded Ratio vs. Accumulation:
Let’s consider two couples. Karen and Josh Spender together earn $150,000 a year, while Johanna and Daniel Saver have a current household income of $120,000. Otherwise, these two couples have the same investor profile, initial portfolio value, investment strategy and expected contribution schedule. Both couples plan to retire at 65 and have a retirement income goal of 60% of their pre-retirement income.
While the Spenders often use their extra income to enjoy themselves – vacations and going out to restaurants — the Savers are far more frugal. They put any extra funds toward their retirement goals. This difference in lifestyles means the Savers, despite their lower income, are projected to have a funded ratio of 123% at retirement, while the Spenders are projected to have a funded ratio of 86%. What does that mean? Let’s take a closer look.
Click image to enlarge
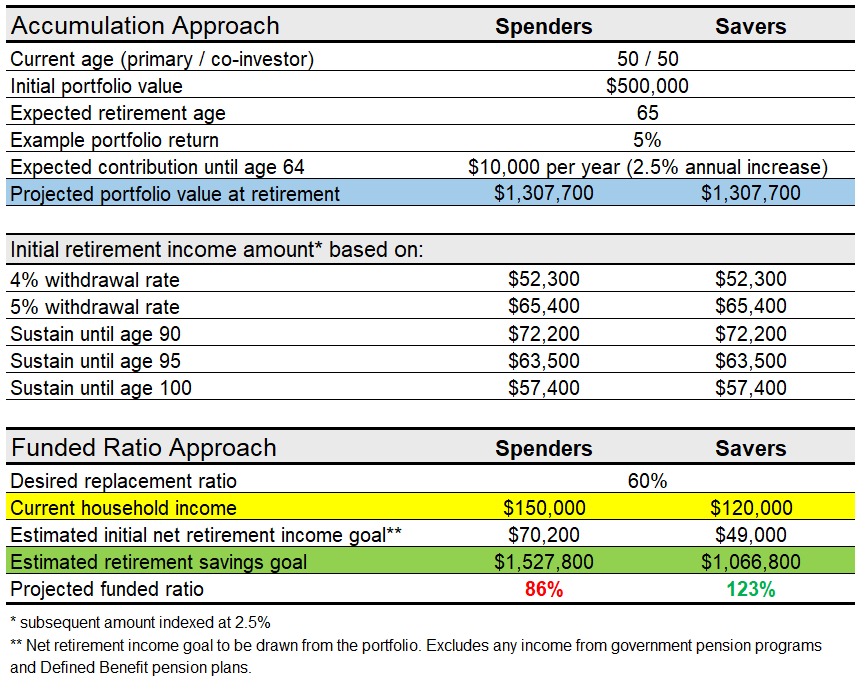
Accumulation Approach
As we can see from the chart, both couples are projected in this simple example to have a portfolio value of $1,307,700 at age 65. Using the accumulation approach, this is determined by projecting current assets based on an example return assumption, in this case, annualized returns of 5% and annual inflation of 2.5% for the $10,000 contribution each year to age 64.
The couples then need to calculate their retirement income goal based on a sustainable withdrawal rate or withdrawal amount to last for a certain period. That means the Spenders and the Savers have to estimate now how much they think they will need to withdraw annually in retirement and how long they need their portfolio to last. Those are very big and very difficult decisions – and the cost of being wrong is huge.
Funded Ratio Approach
Under the funded ratio approach, the two couples will start with what they know (current assets, anticipated contributions and an estimated cost of retirement spending) rather than what they don’t know (how long they will live, what the markets will do).
Steps to determining the funded ratio:
1 — Using current household income and a 2.5% annual inflation rate, we can estimate that the Spenders will have a household income of $217,100 at age 65 while the Savers will have a household income of $173,800.
2 — Since both couples seek a replacement income of 60% of their pre-retirement income, the Spenders retirement income goal is $130,300 while the Savers retirement income goal is $104,300.
3 — The next step is to determine how much their retirement income will come from personal retirement savings, investments and/or an employer defined contribution (DC) plan. In other words, we want to exclude retirement income coming from government benefits such as the Canada or Quebec Pension Plan and Old Age Security (OAS) as well as from any employer defined benefit (DB) plan. This is the retirement income their portfolio will need to generate. That means $70,200 will need to be drawn from the Spenders portfolio and $49,000 from the Savers portfolio.
4 — Then we calculate their total estimated assets at the time they retire. For both couples, this is $1,307,700.
5 — We then need to calculate their total estimated liabilities – the amount they need to accumulate by the time of retirement, i.e., the retirement savings goal. This is done by multiplying the desired net annual retirement spending amount by an immediate lifetime indexed annuity factor.1 This results in total estimated liabilities for the Spenders of $1,527,800 and for the Savers of $1,066,800.
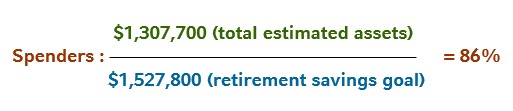
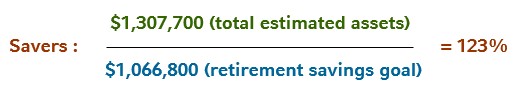
6 — To estimate their funded ratio when they retire, we divide total estimated assets by total estimated liabilities.
Here is the calculation:
The chart below shows the breakdown for the Spenders.
As discussed, their household income rises to $217,100 at age 65. Upon retirement, it drops to $130,300 of which $70,200 is drawn from their portfolio. The remainder comes from Josh and Karen Spender's Canada Pension Plan (CPP) and OAS benefits as well as small amounts from both of their DB pension plans. Josh is shown as "P" for primary investor while Karen is "Co" for co-investor.
THE SPENDERS
Click image to enlarge
Chart 1:
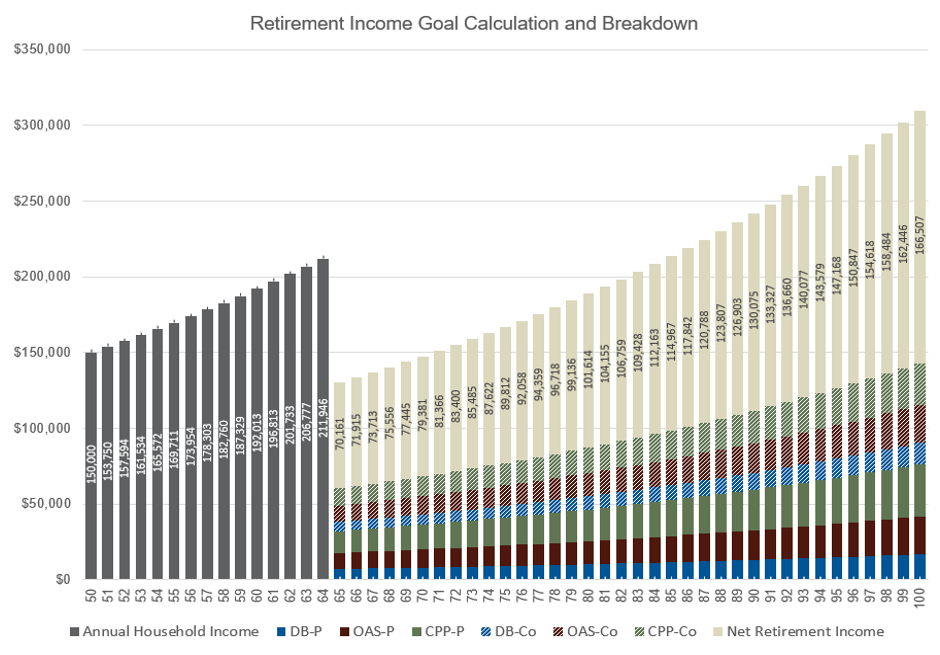
Source: Russell Investments Funded Ratio Tool & Government of Canada. For illustrative purposes only. Josh Spender represented by "P" for primary investor and Karen Spender represented by "Co" for Co-investor. Assumptions for annual inflation assumed at 2.5% & other annual income sources in today’s dollar value (2019): CPP-P = $10,000, OAS-P = $7,290, DB-P = $7,000, CPP-Co = $8,000, OAS-Co = $7,290 and DB-Co = $6,000. For actual average and maximum CPP and OAS payment amounts, please refer to the Government of Canada website: https://www.canada.ca/en/services/benefits/publicpensions.html
So while both couples start out with the same portfolio value, the funded ratio approach shows that they have different retirement savings goals. And the Spenders are in danger of not having the retirement lifestyle they want, while the Savers are in a much better position.
Conclusion
As we can see, the funded ratio approach can be a potentially more precise way of showing your clients whether they are on track to a healthy retirement.
If their projected funded ratio is above 100%:
- they have reduced their longevity risk
- they may have the option to retire early
- they may have the option to increase spending in retirement
- there is a potential for legacy assets
If their projected funded ratio is below 100%:
- they have increased their longevity risk
- they may need to save more
- they may need to take more risk by adding more equities to their portfolio
- they may need to lower their standard of living
- they may need to work longer before they retire
Determining your clients’ funded ratio can help you have the right conversations with them.
1 This factor is used to calculate income adjusted for inflation to the purchaser that starts as soon as they deposit a lump sum and guarantees payment of a predetermined amount for the rest of their life. It replicates the impact of purchasing an annuity upon retirement.