The Global Housing Inspection Report – 2022 edition
- Rising interest rates have already started impacting housing prices in some developed market economies.
- In a flip from the 2008 playbook, the U.S. housing market appears to be the most insulated, while other developed markets exhibit more risk
The bottom line: As interest rates in developed markets continue to rise, we expect that the housing market will soften in developed markets, and need to continue to monitor market trends. Ultimately, despite the short-term headwinds, we believe real estate investments will continue to play a critical role in institutional investors’ portfolios—especially through private markets products.
Background
Amid aggressive monetary policy tightening in several developed markets, some market observers have started to worry about how the housing market might fare. In this report, we conduct an inspection of the housing markets for the U.S., Canada, UK and Australia to identify potential risks and watchpoints. Ultimately, despite the short-term headwinds, we believe real estate investments will continue to play a critical role in institutional investors’ portfolios—especially through private markets products.
Interest rates and housing
Inflation has become a pressing challenge for many developed market central banks. Housing costs often serve as a key driver of core inflation pressures. After all, for many consumers, mortgage payments represent a significant chunk of their budget. Thus, famed American economist Paul Krugman unsurprisingly notes that “one of the dirty little secrets of monetary policy is that it mostly works through housing.” As interest rates rise, consumers will eventually face higher borrowing costs, making home ownership less affordable. In theory, this will put downward pressure on home prices, and therefore help to cool inflation.
In reality, the transmission process isn’t always linear: the higher borrowing costs have the greatest impact when consumers go about renewing their mortgages. Thus, we must understand the different mortgage structures in each region.
Understanding how mortgage structures vary in the U.S., Canada, UK and Australia
In the U.S., the most common type of mortgage structure is the 30-year fixed rate mortgage. This structure means that consumers can lock in their interest rate today for an entire 30-year period. Consequently, even as the U.S. Federal Reserve (Fed) lifts its overnight rate, a notable segment of the population might not see their mortgage costs rise, since their rates have already been locked in.
The U.S. does also offer adjustable mortgages, such as the 5/1 ARM, in which the mortgage rate is fixed for only five years before becoming variable, but these are far less prevalent than the 30-year fixed rate mortgage.
As such, the U.S. housing market should be more insulated against rising interest rates.
In non-U.S. developed markets, mortgage structures with variable rates or shorter fixing periods dominate the market. In Canada, fixed rate mortgages also enjoy significant popularity, but instead of having a locked-in interest rate for 30 years, Canadian consumers often opt for a 5-year fixed rate mortgage. In addition, Canada also offers variable mortgage rates that reset whenever the financial institution’s mortgage prime rate increases—a benchmark rate that tends to move somewhat in lockstep with the Bank of Canada overnight rate. The higher frequency of mortgage rate adjustments mean that at any given time, a greater percentage of consumers in Canada versus in the U.S. are likely to see their mortgage come up for renewal, and as such, the Canadian housing market may be more sensitive to rising interest rates than the U.S. markets.
The UK has seen an evolution in its mortgage rate structure. According to Bank Overground, fixed rate mortgages with terms of five or more years made up the majority of new mortgages in the fourth quarter of 2019, becoming more popular since 2016. And some providers now even offer mortgages with 40-year terms. On balance though, UK residents tend to choose mortgages with terms shorter than those in the U.S., meaning that the policy impact will be felt quicker.
Rounding out our analysis, the RBA notes that variable rate mortgages tied to a benchmark rate known as the standard variable rate tend to be the most popular. This means that out of the four countries we examine in this post, Australia is likely to be the most sensitive to rising interest rates.
The differing mortgage structures also contribute to differences in how mortgage rates have evolved across countries. The U.S., with its long-term 30-year fixed rate mortgage, has seen higher increases in fixed rate mortgages, with the rate having risen from around 3% in late 2021 to nearly 6.3% in mid-June, according to Mortgage News Daily. Mortgage rates have risen somewhat less quickly in countries like Australia where mortgages tend to tilt to a more variable rate structure. With the RBA having hiked interest rates by a cumulative 75 bps year-to-date, this means that the typical Australian mortgage rate has risen by only 75 bps, far less than the increase in U.S. mortgage rates. This may offer a slight offset against the quicker transmission of monetary policy in those regions, but we would still expect to see pricing be more quickly impacted in the developed non-U.S. markets than in U.S. markets.
Recent home price trends show signs of pressure in non-U.S. markets
Now that we’ve examined the mortgage rate structures in these four markets, let’s take a look at some recent trends in housing prices. The chart below shows the year-over-year percentage changes in a popular home price index for each region, with data through March 2022:
Click image to enlarge

Source: Russell Investments’ calculation of year-over-year percentage changes in the values of the S&P CoreLogic Case-Shiller Home Price Index, CANSIM New Housing Price Index, UK England House Price Index, and Australia CoreLogic Home Property Value Index 5 City Aggregate. Index data sourced from Refinitiv Datastream.
From this chart, we see that the effects of rising mortgage rates on U.S. house prices have not fully kicked in yet: the US S&P CoreLogic Case-Shiller Home Price Index grew by more than 20% year-over-year in March 2022, the fastest rate of annual increase since the 1980s.
In the other developed markets, a different narrative plays out. The CANSIM New Housing Price Index appears to have plateaued out in March 2022 at a 13.8% year-over-year rate of increase, with the rate of growth modestly to 12.5% in April 2022. And in Australia, home price appreciation has been decelerating year-to-date, growing at an annual pace of only 14% in April 2022 vs. 21% in January 2022.
Other timelier datapoints also confirm that non-U.S. developed markets may be more vulnerable. In the U.S., the median price of existing homes sold in May surpassed $400,000, exceeding previous historical peaks. But according to the Canadian Real Estate Association, the median price of a home fell by 6% month-over-month in April, and another 5% month-over-month in May. Meanwhile, Australia saw a 0.1% decline in home prices month-over-month in May.
Overall, we’ve already seen signs that the housing market may be losing momentum in several non-U.S. developed markets. And while different price indices may be constructed somewhat differently and give differing indications on the magnitude of price pressures, it is reasonable to conclude that many housing markets may face near-term challenges amid rising interest rates. Moreover, it may only be a matter of time before the U.S. joins the batch of countries experiencing declining home prices. Already, major U.S. real estate companies such as Zillow, Compass and Redfin have announced plans for layoffs, in anticipation of a cooling housing market to come. In the sections that follow, we will detail some other key indicators that we are looking at.
Lack of affordability creating headwinds
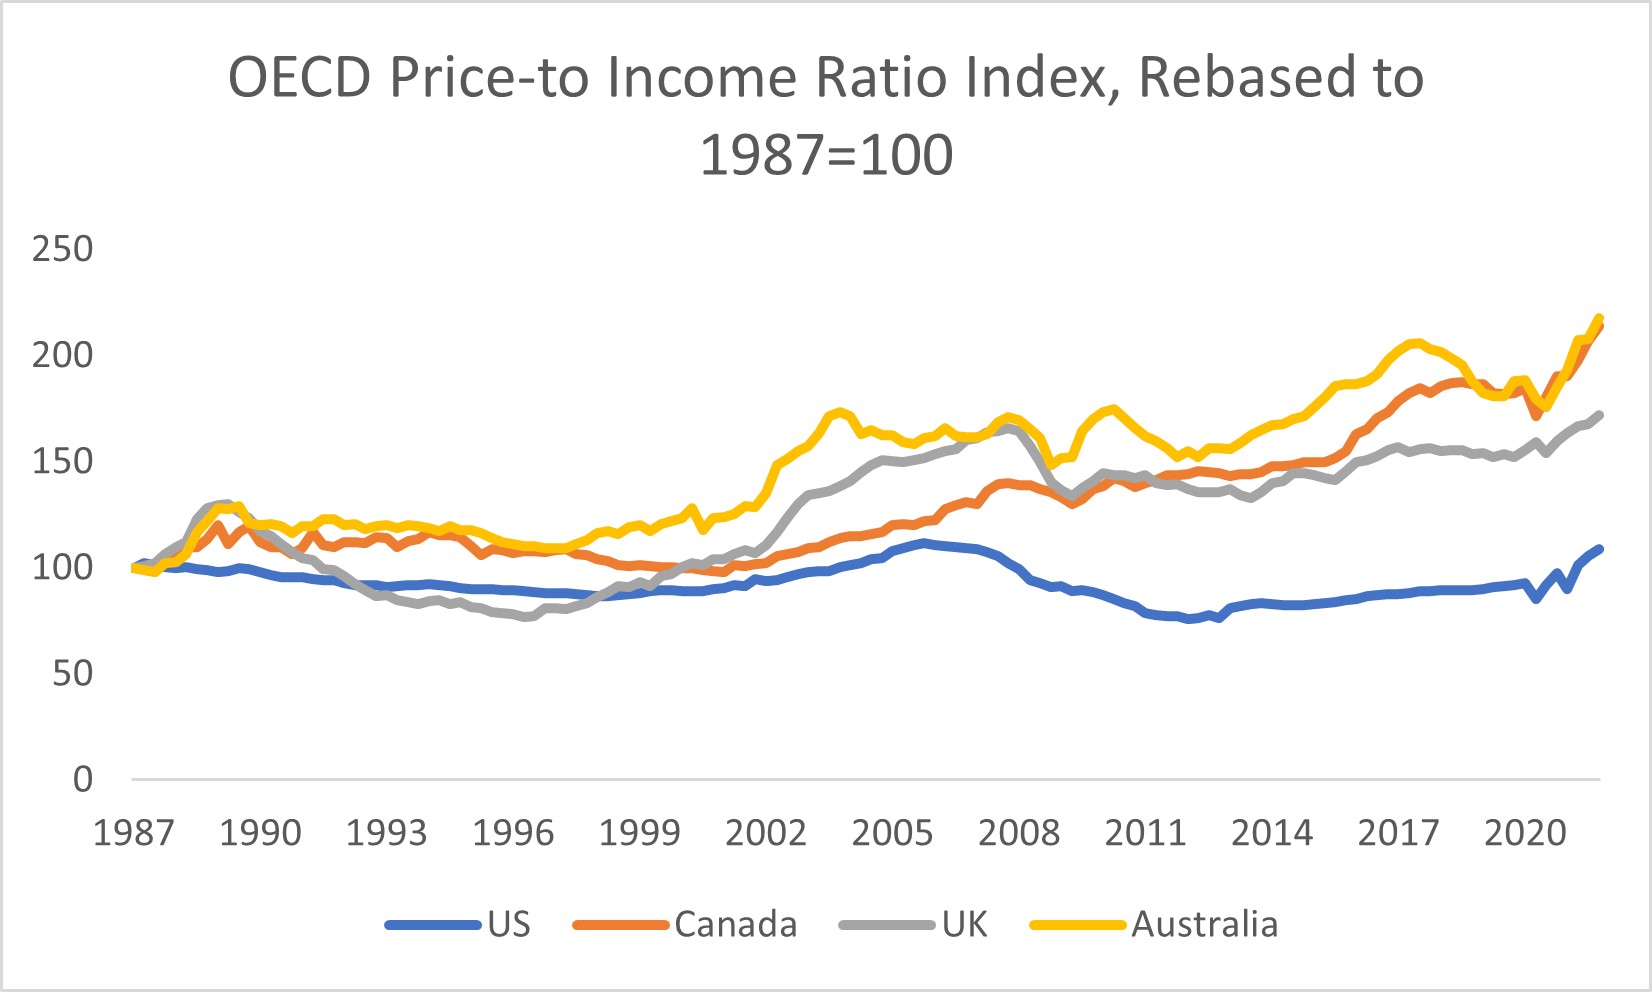
Housing markets that lack affordability could be more prone to price corrections amid rising interest rates. The OECD Price-to-Income Ratio offers a useful gauge of how affordable house prices are across countries by comparing nominal house price indices with disposable income per capita. The higher the measure, the less affordable the housing.
Canada and Australia stand out as the least affordable of the four developed markets. The lack of affordability can put significant strains on the Canadian housing market.
Click image to enlarge
Source: Refinitiv Datastream
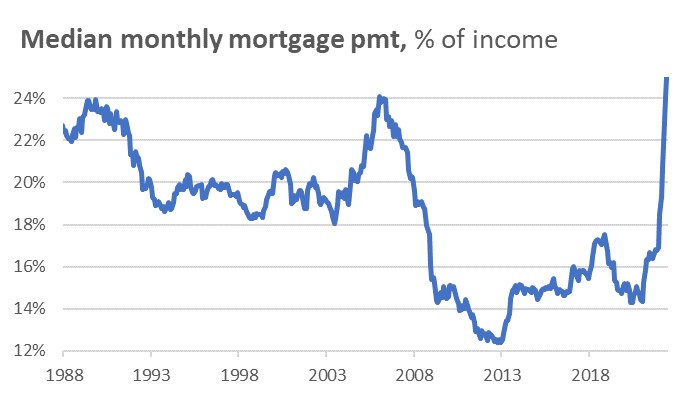
Another useful measure to look at: mortgage payments as a percentage of consumer income. In the U.S., mortgage payments now represent more than a quarter of the typical consumer’s income. While that number might seem small, it’s actually one of the highest numbers historically, suggesting that mortgages have become increasingly unaffordable as interest rates rise.
Click image to enlarge
Source: Consumer income information sourced from Refinitiv Datastream. Mortgage payment calculations are produced using Zillow’s home loan calculator.
Outside of the U.S., the situation appears even more stark. We use a similar approach based on the most recent Canadian Real Estate Association median home price data, the most recent prevailing mortgage rates among leading Canadian banks, Statistics Canada estimate of aggregate Canadian household disposable income, and IBIS world estimates for number of households. This analysis suggests that mortgage payments represent 43% of average disposable income, significantly higher than in the U.S.
And using a slightly different set of assumptions, analysts at National Bank found that mortgage payments might now exceed more than 50% of income for the typical urban homeowner, with some cities like Vancouver seeing mortgage payments exceeding 80% of homeowner income!
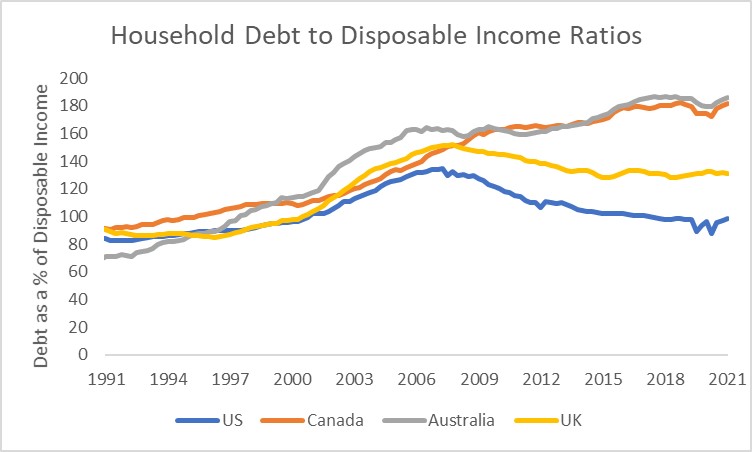
Finally, let’s take a look at household debt levels. At the end of the fourth quarter of 2021, U.S. household debt stood at just under 100% of consumer disposable income, significantly less than the excess leverage heyday that we saw pre-GFC. As borrowing costs continue to rise, we might expect to see this statistic rise up again, but for now it seems relatively healthy.
UK consumers have also deleveraged compared to during the Great Financial Crisis (GFC) run-up, albeit their debt to disposable income ratio exceeds that of the US.
Consumers in Canada and Australia, however, have experienced rising debt to disposable income ratios. The significant amounts of leverage carried by Canadian and Australian consumers make them particularly vulnerable to interest rate increases and mean that it will be much more challenging for these consumers to be able to afford homes and service their mortgages. As housing affordability continues to deteriorate, the risks to the housing market will only increase.
Click image to enlarge
Source: Refinitiv Datastream
Transaction volumes point to potential slowdowns
Across several developed markets, we have seen declines in sales transaction volumes. These declines have been influenced both by not only the increased borrowing costs arising from rising mortgage rates, but also the high cost of housing itself rendering certain transactions too cost prohibitive.
On these metrics, the U.S. housing market has already taken a hit. National Association of Realtors data shows existing home sales fell by 3.4% month-over-month in May 2022, marking four months of decline. Pending home sales fell by 3.9% month-over-month in April, a steeper drop than most market observers had been expecting, and the 6th consecutive month of deterioration. In fact, U.S. pending home sales are now down nearly 19% cumulatively since October 2021.
The domestic situation mirrors the weakness we see in international markets. In Canada, Canadian Real Estate Association (CREA) data shows that the volume of home sales fell by nearly 13% month-over-month in April, and another 9% month-over-month in May. Similarly, in the UK, statistics from HM Revenue & Customs show that property transactions fell by 10.5% month-over-month in April on an unadjusted basis. In May, property transactions in the UK did rebound, but only by a weak 1.6% month-over-month, and property transactions are still below where they were a year ago.
Population growth may not be sufficient
Historically population growth has been cited as one of the factors contributing to a robust housing market. But as birth rates decline across developed countries, population growth rates are expected to slow, which can remove some of the support global housing markets have historically enjoyed. First, let’s examine overall population growth. The table below shows the expected annual population growth rate over the next five years. Even in Australia, the country with the projected fastest rate of growth, the population growth rate might only be a meager 1.12% per year. The UK, the slowest of the four regions we examine, is expected to only see a population growth of 0.44% per year.
| 2022 population (millions) | 2027 population (millions) | Annual % increase | |
| U.S. | 337.34 | 348.70 | 0.66% |
| Canada | 38.23 | 39.59 | 0.70% |
| UK | 67.79 | 69.30 | 0.44% |
| Australia | 26.14 | 27.63 | 1.12% |
We can also look at the growth in the population of 30- to 54-year-olds within each country, as people in this age range are more likely to have children, and therefore more likely to need to purchase a home. Once again, we see that population trends favor the Australian housing market, while disfavoring that of the UK.
| 2022 population of 30- to 54-year-olds (millions) | 2027 population of 30- to 54-year-olds (millions) | Annual % increase | |
| U.S. | 107.73 | 110.99 | 0.60% |
| Canada | 12.67 | 13.19 | 0.80% |
| UK | 22.20 | 22.42 | 0.20% |
| Australia | 8.80 | 9.24 | 0.98% |
Source for both charts: United States Census Bureau International Database
Of course, these population growth rates are estimates, and it is possible that immigration reform measures could offset the declining birth rates and lead to higher-than-projected population growth. The Canadian government has pledged to increase the number of permanent resident admissions to around 450,000 per year in the coming years, for example. Nevertheless, we still expect that the era of population growth providing significant support to the housing market may be coming to an end.
Housing supply
The final lens we use to view the housing market is through housing supply. While some market participants have looked at ratios of housing inventory to sales transactions to gauge the tightness of housing supply, we note that this approach can be prone to distortions if sales volumes differ significantly from their typical trends. Therefore, we will look at measures of housing supply relative to a country’s population instead.
Starting with the U.S., we can see that the ratio of existing home sale listings relative to overall population is at the lowest level in nearly 40 years.
Click image to enlarge

Source: Refinitiv Datastream and Federal Reserve Bank of St. Louis
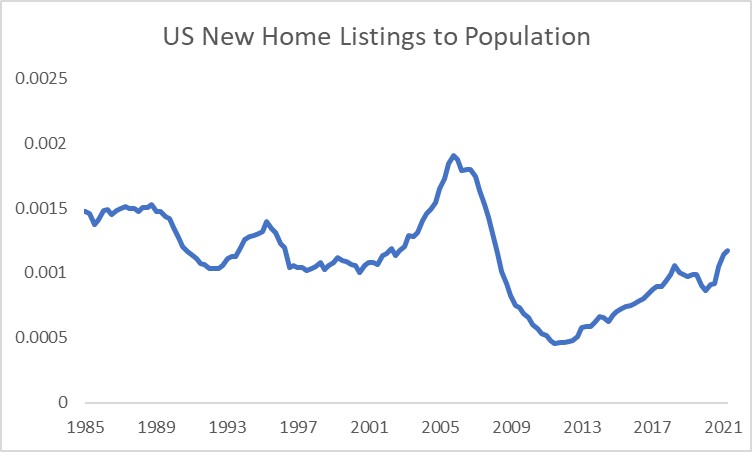
From a new home listings perspective, the data shows that housing supply has been increasing in recent years, though we are still far below the levels we saw in the run-up to the global financial crisis. This makes a 2008-style housing market meltdown in the U.S. unlikely, despite the pressures from rising interest rates.
Click image to enlarge
Source: Refinitiv Datastream and Federal Reserve Bank of St. Louis
Next, let’s turn to Canada. The ratio of housing starts to population has been falling recently, though it is still above its 2010-2020 trend. If housing starts continue to moderate relative to population, this might suggest that homebuilders are becoming more disciplined, and could serve to offset some of the price pressures that we have been seeing in Canada.
Click image to enlarge
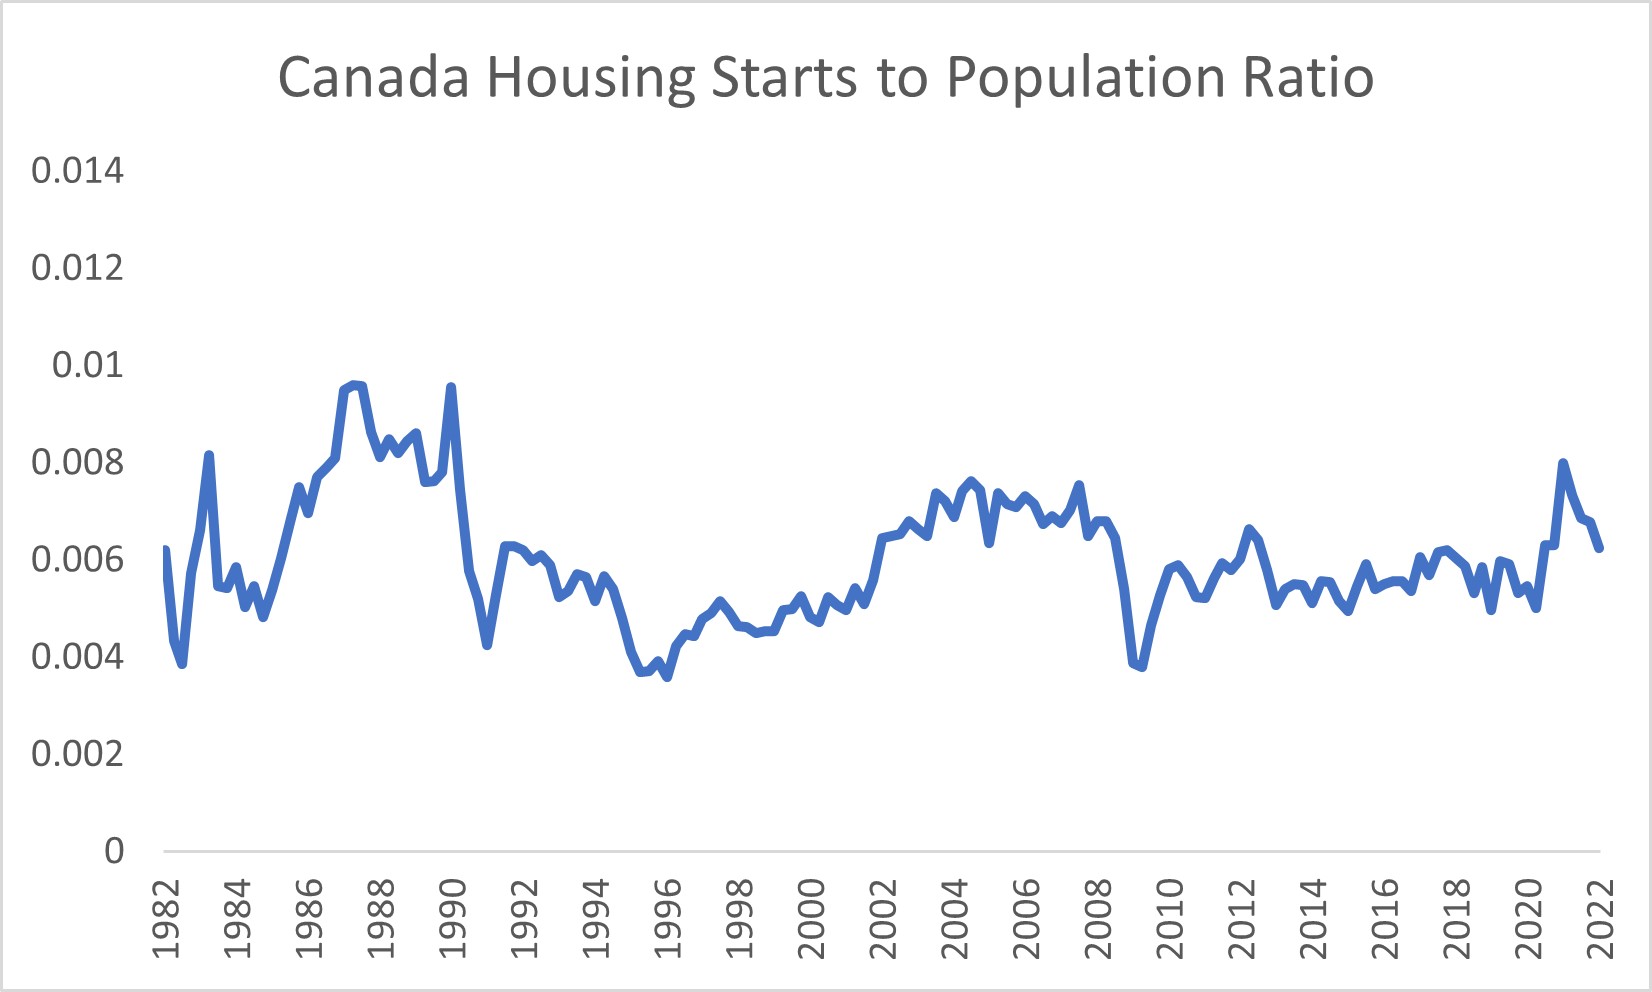
Source: Refinitiv Datastream
The UK sees a relatively high housing-starts-to-population ratio compared to the historical trend, even though the ratio has been falling a bit in recent months. As such, we assess that the UK has less of a supply constraint for housing, which gives it less of a buffer in the wake of falling house prices.
Click image to enlarge

Source: Refinitiv Datastream
Finally, we turn our attention to Australia. If we examine the ratio of Australia dwelling approvals to population, we see that the ratio remains close to its historic highs, though it has begun to fall recently. For now though, supply of housing appears not to be too tight, removing a potential cushion to dent the impact of falling prices.
Click image to enlarge
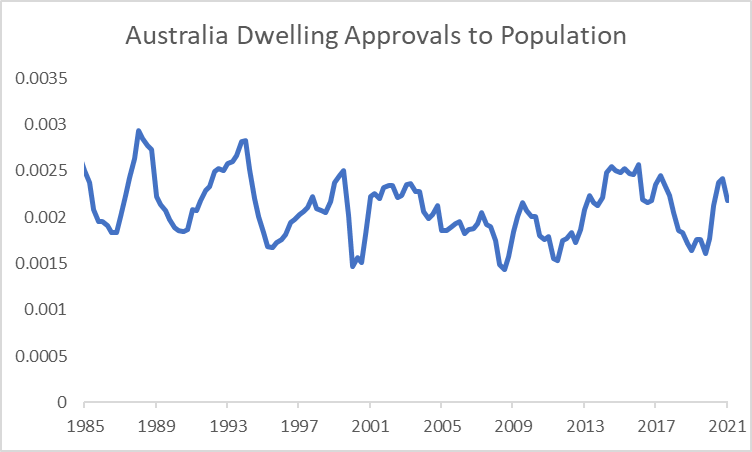
Source: Refinitiv Datastream, Australia Bureau of Statistics
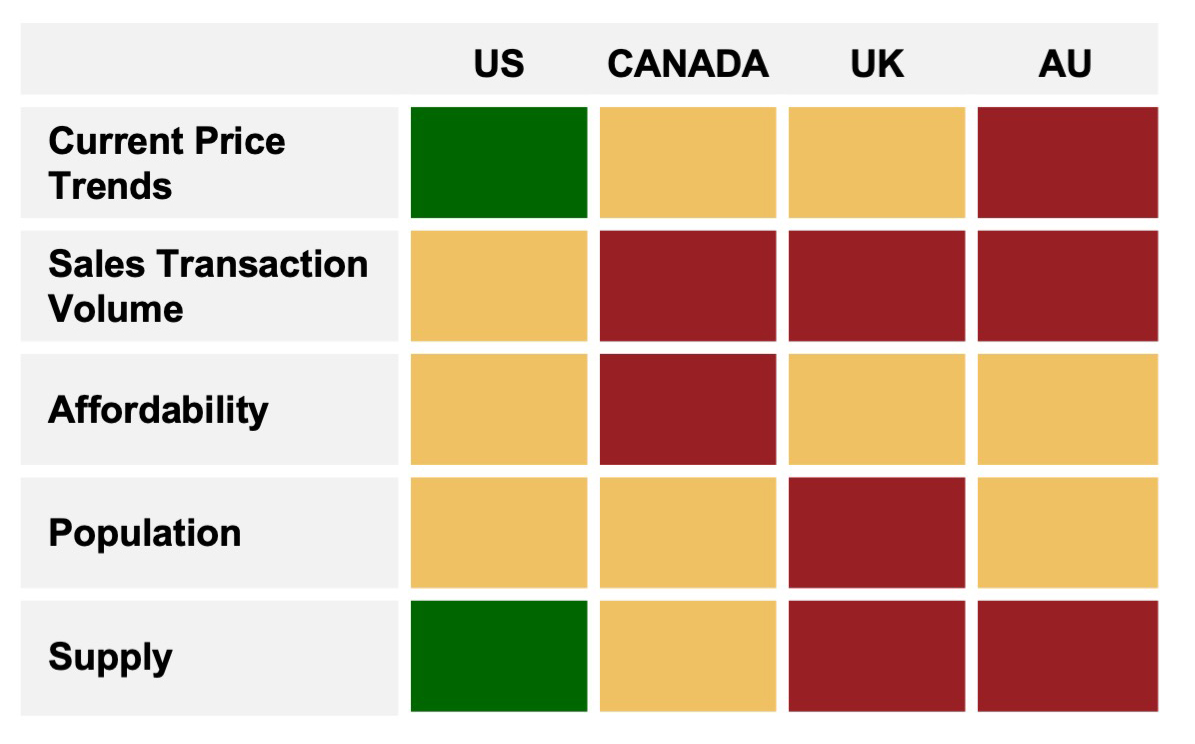
Final scorecard
Now that we’ve assessed some key housing market metrics, it’s time to compile the results. Unlike in the housing bubble that led to the GFC, this time around, the U.S. housing market appears to be the most insulated. Meanwhile, the housing market in the non-U.S. developed markets show warning signs that we cannot ignore.
In the heatmap below, green = low risk, gold = intermediate risk, red = high risk. We caveat that just as a home inspection should be carried out periodically, so too must the evaluation of the housing market. Our findings are only based on the most recent market data, but the landscape could evolve rapidly. While we should not necessarily worry about a 2008-style crash, we must always be mindful of the risks and stay disciplined as investors.
What role can real estate play in a multi-asset portfolio?
Even though the housing sector might face some near-term headwinds, we still believe that real estate investments can play an important role in an institutional investors’ portfolio. In a world of volatile equity markets, investing in real estate, especially through private market products, can help offer a source of diversification and reduce overall portfolio risk, as well as provide a source of stable income.
It’s important to remember that residential real estate is only one of several types of real estate assets. By diversifying your real estate portfolio into other real assets such as office space, industrial and commercial properties, your portfolio can have the growth benefits of real estate while also being insulated from short-term housing market corrections.
In addition, when inflation rates eventually moderate and the era of aggressive monetary policy tightening has elapsed, even residential real-estate investments can still provide opportunities for long-term growth.
The bottom line
We think that institutional investors with a long time-horizon should not panic in the face of the near-term headwinds. Rather, by being aware of the risks and the potential differential impacts across regions, institutional investors can make better choices in managing their real estate investments. With our collective expertise, Russell Investments can be an effective partner in helping you address your investment and liquidity needs, and create a customized solution that works for your organization.
Any opinion expressed is that of Russell Investments, is not a statement of fact, is subject to change and does not constitute investment advice.