Market pullbacks in perspective
The recent and continued pullback in U.S. stocks has been unsettling for investors. It’s hard to believe how different the investing world looked on the prior peak of February 19, 2020. The market pullback and broader impacts from the global pandemic has been fast, uncertain and material. In four weeks, investors have seen U.S. stocks (S&P 500 Index) lose more than 30%. For an investor in stocks, it feels like we are in uncharted territory.
It is interesting to compare this equity pullback with the last market pullback of similar magnitude. In Exhibit 1, we compare a hypothetical investment of $100 in U.S stocks (S&P 500 Index) for two different time periods starting: 1) September 12, 2008 – the day that Lehman Brothers declared bankruptcy and a major inflection point for the Global Financial Crisis (GFC) in 2008/2009, and 2) February 19, 2020 - the top of the equity market in 2020.
Admittedly, the extreme volatility in today’s market is not over, but it is still interesting to compare the two events when overlaid by duration. While the two events are different, investors remember how challenging it was to stay invested during the GFC. Investors hit the bottom on March 9, 2009 - of course no one knew then that was the bottom. Staying invested was difficult, but long-term investors were rewarded.
Exhibit 1: Growth of $100 for U.S. stocks: Post-Lehman bankruptcy vs. current
Click image to enlarge
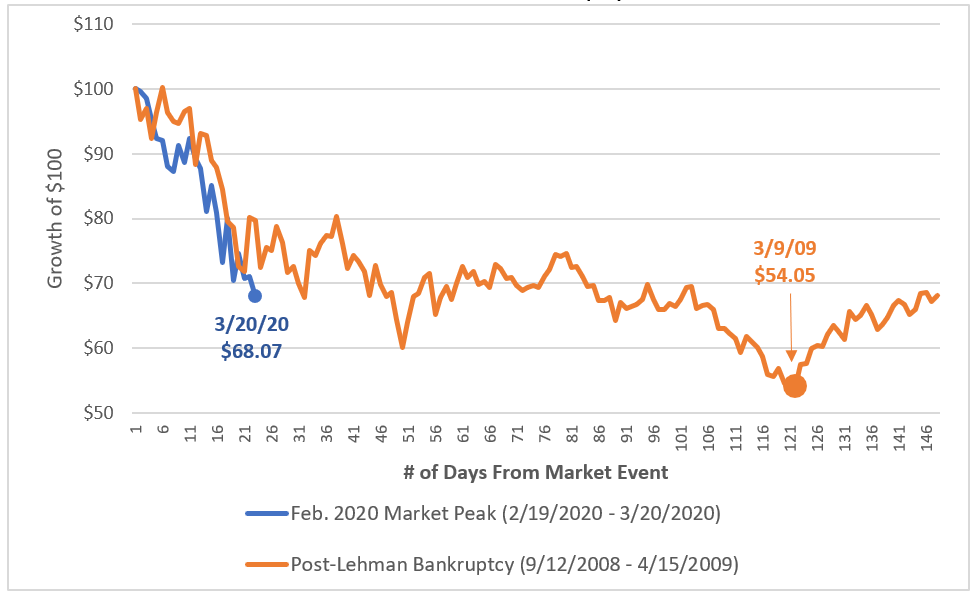
Source: Yahoo Finance, U.S. Stocks = S&P 500
Looking at daily volatility
It is also interesting to look at the volatility for U.S. stocks over this entire time. In Exhibit 2, we show the daily percentage change for U.S. stocks as measured by the S&P 500 Index. If one excludes the GFC and recent pullback, markets have been reasonably range bound for daily percentage changes.
The recent pullback has seen the 1st and 2nd worst pullbacks in percentage terms since the Lehman collapse. Conversely, this time period has also seen the 3rd and 9th best days in percentage terms – highlighting the challenges of trying to time the market. Note that for the time period shown, U.S. stocks were up a cumulative 84%. Investors who stayed the course have been rewarded.
We believe it’s important to remember to focus on percentage changes in the markets. Don’t be swayed by headlines that talk about the biggest drops/gains in points. The higher the market, the less meaning points have. Focus on the % change.
Exhibit 2: Daily percentage change in U.S. stocks (9/12/2008 – 3/20/2020)
Click image to enlarge
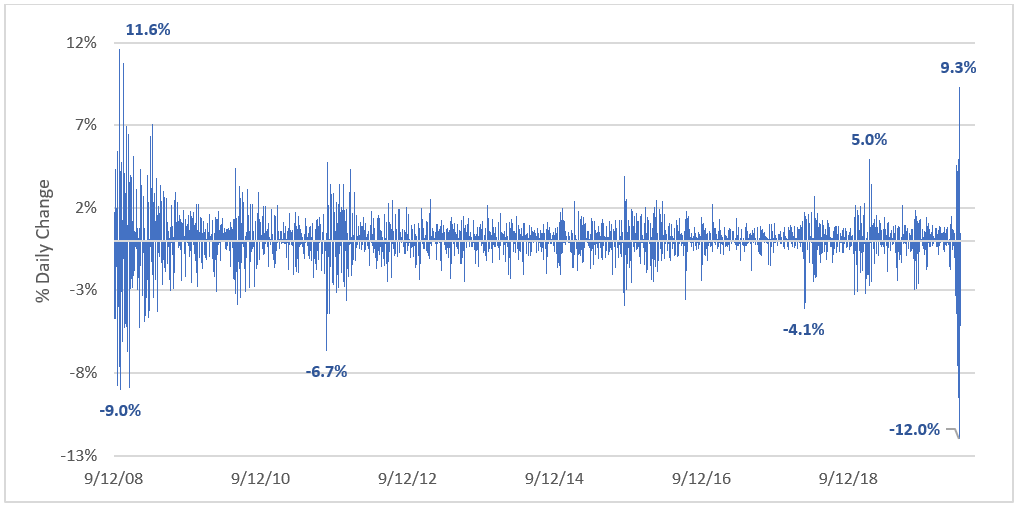
Source: Yahoo Finance, U.S. Stocks = S&P 500
The recent market volatility and pullback feels different than prior pullbacks, but they are always different. As my colleague Paul Eitelman wrote on March 18th, this volatility reflects some big moves and is already in-line with the median peak-to-trough damage around historical global recessions.
In other words, keep looking through the noise. And keep your long-term strategy in focus.