Is the stock-bond correlation positive or negative?
Some periods of history might point to the conclusion that the correlation between the returns on stocks and bonds is positive, others that it is negative. These variations can be a signal of fundamental change in the broader market environment.
Phase transitions
The behaviour of investment markets is not fixed. There are periods, for example, of relatively high market volatility and there are periods of relatively low market volatility. Stas Melnikov leads the Russell Investments team that is responsible for oversight of investment risk, a task made considerably more difficult by the fact that models can become useless – or worse – when the market environment is changing. To monitor those changes, the team uses a Regime Assessment Tool.
Stas explains that this tool is based on a view of market volatility as “susceptible to large jumps, or regime changes. But there’s no announcement to tell you when that happens. What we do observe are the returns. And so based on the returns, you can infer, and you can reverse-calibrate this model to detect what kind of volatility regime you are most likely in today. You cannot predict when the regime is going to change, but you can detect the change when it happens.”1
Correlation regimes
It’s not only the volatility environment that changes, though; correlations do, too. The interaction between the returns on stocks and bonds is one of the fundamental building blocks of asset strategy, and the nature of that interaction is not constant.
For each calendar quarter from 1989-2016, the chart below shows (in orange) the correlation of the daily returns on the Russell 3000™ U.S. equity index and the Bloomberg U.S. Aggregate bond index. It also shows (in blue) the annualised volatility of the daily equity returns and (in grey) of the daily bond market returns.
Equity and bond market volatility and correlation, 1989-2016
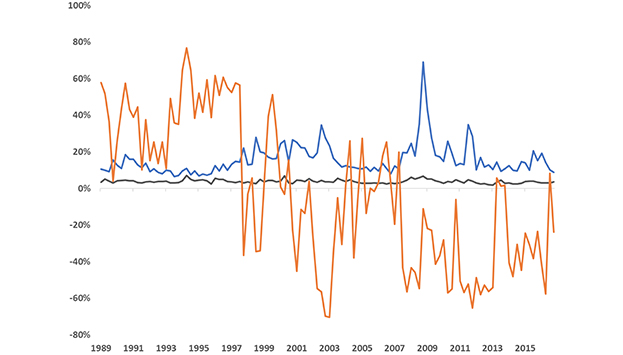
Source: Russell Investments
Bond market volatility ranged from 1.9% to 7.0%, and equity volatility from 6.5% to 69.1%. The most striking feature of the chart, however, is the transition in late 1997 of the correlation from being positive to being mainly negative.
This is not the first time this has happened. In a 2003 paper in the Journal of Fixed Income, Antti Ilmanen looked back as far as 1926 and found that, although the stock-bond correlation was positive the majority of the time, there were three significant spells of negative correlation: 1929-1932, 1956-1965 and from 1998. Ilmanen conjectures that behind these results lies that “the causality from bond prices to stock prices is positive (say, falling bond yields tend to also reduce equity discount rates), while the causality from stock to bond prices is negative (say, equity weakness can prompt monetary policy easing and a bond market rally.)”2 Stas adds that the correlation can be influenced by confounding variables, specifically the observation that, “good news for the economy can be good news for bonds, but sometimes good news is bad news.”
Inflation seems to have been a major factor according to Ilmanen: “Stock-bond correlation tends to be lowest when inflation and growth are low – deflationary recession – and when equities are weak and volatile – flight to quality episodes.”3
The latter point confirms what most people would expect (and what is observable in the chart above): that the volatility environment and the correlation environment are somewhat related. In particular, low equity market volatility seems to be associated with a high stock-bond correlation. However, volatility regimes seem to be less stable and to change more frequently than correlation regimes. Stas explains what this means from the risk manager’s perspective: “Volatilities are asset-class specific, but correlation is a function of the fundamental state of the economy. So if we see volatility regimes change for a single asset, we are not as concerned as if we observe the correlation regime change. We take the latter as an indication that something fundamentally is changing.”
The significance of the correlation regime is worth bearing in mind when setting strategic asset allocation policy. For most investors, a negative stock-bond correlation is helpful, because it enhances the diversification within a typical portfolio. Pension plans are in an unusual position in that a negative stock-bond correlation can add to risk, increasing the likelihood of the double-whammy of falling asset values and rising liability values.
1 Collie, R. (2015) “Perspectives on Risk Management: Ten Conversations” Russell Investments Research.
2 Ilmanen, A. “Stock-bond correlations.” The Journal of Fixed Income, September 2003.
3 Ibid.