Managing risk biases
As a child, you no doubt heard the old rhetorical saying, just because your friends do it, doesn’t mean you have to. Often the piece of sage advice parents are trying to impart with these words is along the lines of, just because the group is heading in one direction, doesn’t mean it’s the best option.
This general concept applies to equity investing as well, especially for asset owners who use multiple managers and strategies. We find that it is increasingly important for asset owners to have tools to take control of risk and exposures in their total portfolio, and we believe using completion portfolios is an effective approach to accomplishing this. Completion portfolios are custom-designed for each overall total equity portfolio, and can adapt through time to meet evolving exposure needs.
Even though various active investment strategies might be diversified on several dimensions, including sources of alpha, common risks can still present themselves. Asset owners will often hire a diversified set of active strategies, but what we find are risk biases that don’t diversify away can ultimately drive a significant portion, or even a majority, of the overall portfolio’s active risk.
Examples of unmanaged risk biases
For instance, we often see global managers who are overweight emerging markets. This isn’t surprising, as we expect more alpha and stock selection opportunities in this asset class, but what that means for an asset owner is their overall investment is persistently overweight emerging markets, regardless of whether this risk aligns with macro views and risk budget.
Another example is active managers are often overweight the volatility risk factor (stocks that have larger-than-average price changes), which has historically been a negative contributor to returns. At many points, over 80% of active managers in the universe are overweight this risk factor1, so it’s nearly impossible to control this risk using active managers alone.
This behavioral bias is understandable. When managers can identify good stocks and avoid bad stocks, large price swings in these securities mean more return opportunities. This is also called the lottery effect. The problem is that this risk can present itself as a major component of an asset owner’s overall risk budget, and worse still, this factor has a historically negative payoff.2 So, by following the herd and being overweight volatility, an asset owner may unintentionally be owning a risk that is robbing them of returns in the long run.
This is a classic agency problem: The asset owner’s priority is the overall portfolio, while the active manager is focused solely on the portion under their management.
So, what can be done?
Enter completion portfolios.
Three ways completion portfolios can help manage risk
We believe that completion portfolios can be used to improve risk-adjusted outcomes of a total portfolio by focusing on three key areas:
- Removing unintended and unrewarded risks from the total portfolio. These are risks that may constitute leftover baggage from active management that each manager can’t control—either on their own or in aggregate. The asset owner is going to experience these risks, and it’s in their interest to take control of them.
- Embedding systematic return premia. By using investment strategies, like factor portfolios, as the building blocks for a completion portfolio, the asset owner can embed systematic return premia in the overall portfolio. We believe this is a smarter approach than using passive alternatives to control for aggregate exposures.
- Providing the opportunity for dynamic management. Market cycles, relative valuations and market sentiment all have an impact on return (and risk) opportunities over a medium horizon. Having a flexible completion portfolio provides an efficient mechanism for asset owners to position their portfolio for the market environment ahead.
Let’s put this concept to work in an actual portfolio.
As an example of how we can incorporate and think about these areas of focus, let’s consider a common global equity total portfolio structure (“Total Portfolio”), with 70% of the capital allocated to five active global equity managers with varying investment disciplines and 30% allocated to passive equity.
When we look at the aggregate risks of this portfolio, the first thing we notice is an overweight to the volatility risk factor. This is not surprising when investing with active managers. In fact, often times we find over 75% of the active management community is overweight this particular risk factor.3
Below is a timeseries of all active managers in Russell Investments' global equity manager research universe. You’ll notice the bias from the active management community leans toward this risk. This is also a risk factor that has proven to negatively impact performance with a fair amount of consistency.
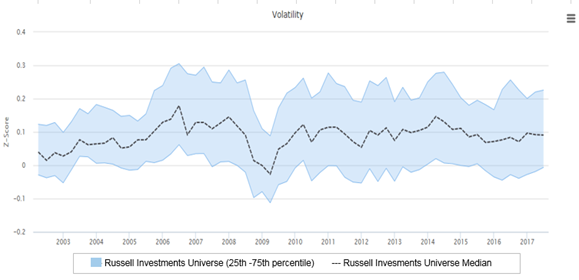
Source: eVestment, Russell Investments.
Russell Investments universe consists of broad global large-cap equity portfolios, with a membership of approximately 300 products.
Z-score: Cap-weighted mean scoring. Anything greater than 0 implies higher volatility than the benchmark, and vice versa.
Market participants and the academic community have seen exposure to high volatility stocks present larger risk and lower returns to portfolios, on average, so this ends up being a negative impact to the overall portfolio. This can be classified as an unintended and unrewarded risk for an asset owner—something to be avoided.
In addition, we found that this set of managers had a large overweight to emerging markets and an underweight to U.S. equities—another common bias with active managers.
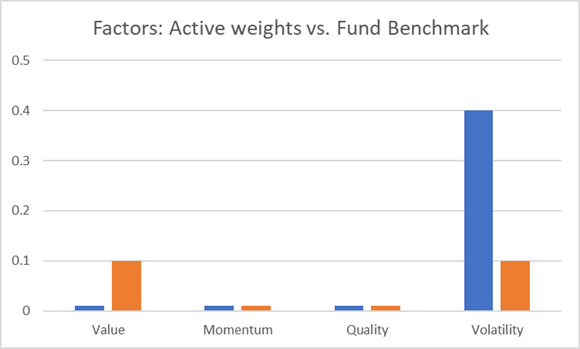
Next, we can evaluate the impact of adding a completion portfolio into the Total Portfolio, with allocations to developed markets factor portfolios. This will allow the asset owner to control for factor risks as well as the regional risks.
Additionally, from a strategic return premia and dynamic management perspective, the asset owner may prefer to have a value exposure represented as well, to enhance expected returns going forward. By re-allocating the 30% passive allocation to a completion portfolio and investing in low volatility and value factor portfolios, an asset owner would be able to re-orient the Total Portfolio’s factor and region risks to:
- Remove unintended risks;
- Take advantage of return premia, and;
- Dynamically manage key exposures.
In the chart below, we can see that by adding a completion portfolio, an asset owner would materially reduce unrewarded risk in the volatility factor, and re-orient some of that risk budget to the value return premia.
Source: Russell Investments equity manager universe and analytics, Axioma fundamental risk model.
From a regional risk point of view, active managers often overweight emerging markets due to the ripe stock selection opportunities. While this can be attractive from an alpha perspective, an asset owner can control their overall regional risk by investing the completion portfolio in developed markets, reducing much of the emerging markets overweight and U.S. underweight.
Controlling regional risk with a completion portfolio
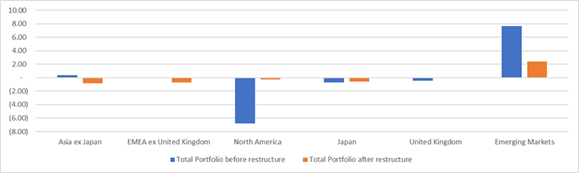
Source: Russell Investments equity manager universe and analytics, Axioma fundamental risk model.
Bottom line
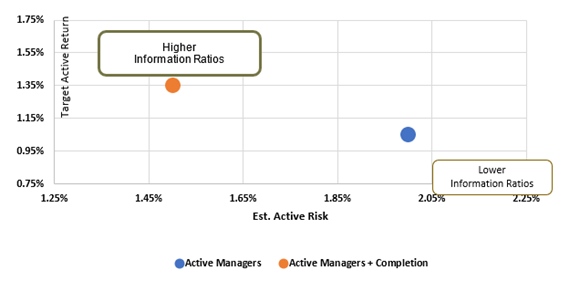
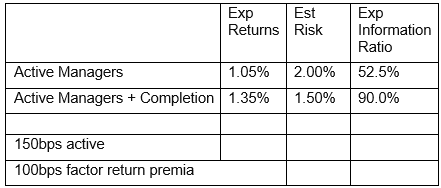
Potential benefits from a risk and exposure perspective aside, ultimately, what’s most important for an asset owner is their expectations around risk-adjusted returns after adding a completion portfolio.
With some simple assumptions related to excess return assumptions (namely, 150 basis points for active managers and 100 basis points for factor portfolios used in the completion portfolio4), we can model out the projected impact on risk-adjusted returns. With the dual impact of helping to reduce unrewarded risk and adding a diversified return source, the asset owner’s expected information ratio for the Total Portfolio dramatically improves with a completion portfolio.
Chart: Risk-adjusted return expectations
Source: Russell Investments and Axioma Fundamental Risk Model. For illustrative purposes only. Does not represent a specific investment.
Source: Russell Investments and Axioma Fundamental Risk Model. For illustrative purposes only. Does not represent a specific investment.
1 Source: Russell Investments research, based on approximately 300 products in the broad global large cap equity universe, covering over 15 years
2 Source: Russell Investments research, Axioma fundamental risk model
3 Source: Russell Investments equity manager universe
4 Source: Russell Investments manager research and Russell Investments factor portfolio research