Passive investing: Are you buying high?
All asset allocations come in and out of favour. Growth versus value. Equity versus fixed. And passive investing is no different. Passive vehicles are clearly popular right now. On the most fundamental level, does that popularity make them a good choice? Is it possible that investors moving into passive are moving in at the top of the market? Is it possible those investors are making the fundamental mistake of buying high?
The focus on regulation and recent performance
The global movement towards passive investing, especially in large cap U.S. equities, has been ongoing, as noted in a recent article by the Wall Street Journal last month. Passive vehicle performance returns have dominated those of active managers for the past five years in the U.S., as noted earlier this year by Barron’s.
In Europe, the performance of passive vehicles compared to active managers over the last 10 years only drives the point home further. Combined with the recent regulatory focus on fees, these factors are leading advisors to seriously contemplate increasing allocations to passive.
The historic cycle of active and passive
While these considerations about performance and fees are valid, keep in mind that the past years may not be reflective of the environment we face over the years to come. It is important to understand that the active/passive decision is hard to make when looked at over the entire market cycle. I believe that the right answer for most investors is active and passive.
But we should be aware of the current relative attractiveness of the average active strategy versus the passive alternative before making the decision. As with all investing, it’s rarely ever a good idea to buy high and sell low.
Let’s take a step back and look at the historical context of active and passive, using example data from large-cap U.S. equities. This cyclical relationship has varied over time, but the two most extreme pro-passive cycles I have experienced—in my career of 30-plus years—are the late 1990’s and today’s environment. We’ll look at these two examples to gain some insight about the causes of cyclicality.
In general, most active managers exhibit persistent biases1. These can lead to consistent factor-level investment bets that help explain relative performance versus the benchmark over the course of the market cycle. Here are a couple of U.S. large-cap manager biases we’ve observed in our own research:
- Often overweight mid-cap stocks and underweight mega-cap stocks
- Usually prefer higher volatility stocks, which leads to common sector underweights to lower volatility stocks, particularly in sectors like utilities and consumer staples
In the late 1990’s, before the tech bubble of mid-1998 until early-2000, there was the “new nifty fifty”. This referred to the total performance dominance of the largest fifty stocks (or mega-cap) over every other cap tier in the Russell 1000® Index in 1997 and 1998, and to a lesser extent, in 1999. Given that most active managers generally underweight mega-cap stocks, the relative performance of active managers in that era was not impressive. An average large-cap manager, or a manager exhibiting performance close to the arithmetic mean of the universe, underperformed the Russell 1000 Index from 1994 to 19992.
Given this environment, you might have thought going passive was a good move at the time. However, even the average manager outperformed the Russell 1000 Index in 2000 by 7.74%. Above-average3 managers did even better. This continued for the next five years4. It helps to show that when you decide to go passive in your investments matters. When you decide not to do so matters as well.
Avoiding the buy-high trap
This late 1990’s history can help inform today’s active/passive debate. The Russell 1000 Index has beaten active managers over the last five years ending September 30, 2016. Much of this performance has been driven by holding more of the lowest volatility stocks than the average manager, particularly within utilities and consumer staples5. In the last three years, the lowest quintile6 of price volatility stocks has outperformed the S&P® 500 by 5.36% as of September 30, 2016. These same stocks also tend to be large-cap stocks, representing 34% of the market capitalisation of the index. This performance run-up has led to the prices of these stocks being overvalued as seen below:
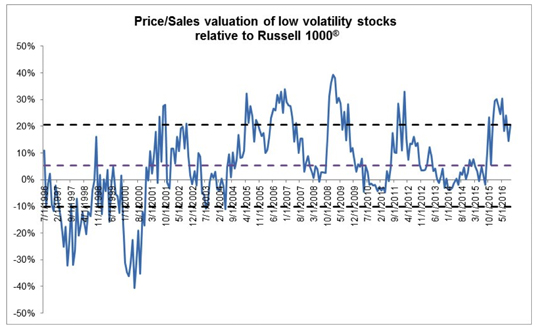
Source: Russell Investments research and Russell 1000® Index. Indexes are unmanaged and cannot be invested in directly. Returns represent past performance, are not a guarantee of future performance, and are not indicative of any specific investment.
At this point in time, U.S. large cap equities are expensive relative to other equities—and to their own history. This is amplified when we look at low volatility stocks, which represent a third of the Russell 1000 by market capitalisation. So you can see, passive investments in this asset class can end up overweight to the most expensive of an expensive lot.
Keeping timing in mind
While passive investments can have a legitimate role to play in many investment strategies, introducing or doubling down on them now looks a lot like a buy-high move. Cycles come and go, so when we make decisions matters . . . a lot.
1When referring to active managers throughout this blog, we define the universe as follows: approximately 1,200 funds with broad market, value tilts or growth tilts that are typically benchmarked to the corresponding Russell 1000 Index or S&P 500 Index.
Based on Russell Investments’ observations of market cycles, which are typically 6-8 years long and are measured from market peak to market peak or market bottom to market bottom. Our observations cover the period from the early 1970s to the present.
When referring to active managers throughout this blog, we define the universe as follows: approximately 1,200 funds with broad market, value tilts or growth tilts that are typically benchmarked to the corresponding Russell 1000 Index or S&P 500 Index.
2Source: Manager universe mean vs. the Russell 1000® Index.
3Above-average refers to managers with performance above the previously calculated arithmetic mean.
4Source: Manager universe mean vs. the Russell 1000® Index.
5Source: Manager universe mean vs. the Russell 1000® Index.
6Lowest quintile is defined as the 200 stocks within the Russell 1000 Index with the lowest price volatility.
Erik Ristuben, Chief Investment Strategist, Client Strategy