The case of two masked returns
The premise
In 1999 DVD players were all the rage, there was panic over Y2K and “Who Wants to be a Millionaire” was on. At that point average annual returns were high for the S&P 500, the S&P/TSX Composite Index and most mutual funds—until the bubble burst.
I worked in a call centre at the time, and people would call to do their mutual fund research. The first question was almost always, What was your best performing fund? Some of the savvy investors would be bold enough to ask, What was your best one, three and five-year performing fund? That was long-term investing for them. I can’t remember a single investor asking, How much risk is the fund taking to achieve that performance? As a new kid to the industry, I didn’t see anything wrong. People were making more than 100% returns and I thought I was getting into the best industry in the world (I still believe that, by the way). You all know how this story ends.
The same thing was happening only a few short months ago. Some investors were thinking diversification was broken and they should own what did well, which was more U.S. large cap stocks. That is what can happen when you think only about return, not risk-adjusted return.
The suspects
Let’s look at two investments: The U.S. large cap market and a hypothetical balanced 60% equity/ 40% fixed income portfolio.
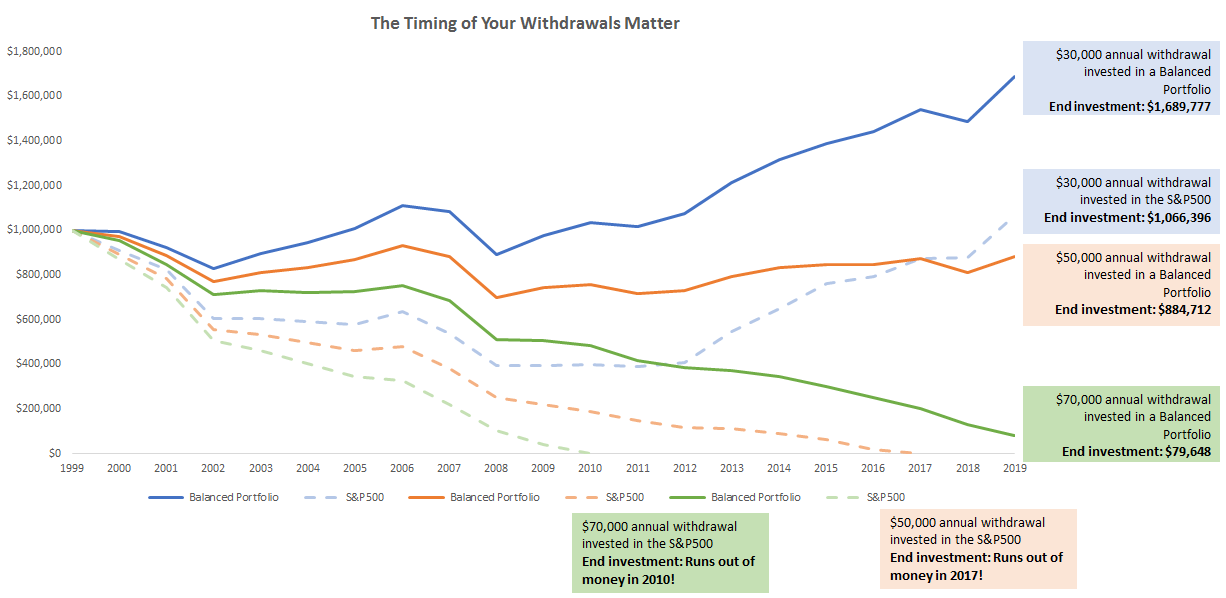
As of the end of 2019, the U.S. large cap market had averaged 18.7%1annually over the previous 20 years, and the 60% equity/40% fixed income balanced portfolio, 5.5%2, both in Canadian dollar terms. Based on that alone, U.S. large cap would seem like a better option. However, clients who invested at the beginning of the 20-year period and withdrew money for retirement had a very different experience. Most of us don’t save money just for the sake of saving it.
If you had saved hard over the course of your entire life and build up a nest egg of $1,000,000 and wanted to take $50,000 out each year to live off, which investment would appear more attractive? In 1999, the 20-year annualized return for U.S. large cap was 18.7% compared to 14.5% for the hypothetical balanced portfolio. Investors calling into my call center would have believed the investment with the best 20-year performance would give them a better outcome. The reality is much different. The investor who placed $1 million into U.S. large cap would have run out of money in 2017. The boring balanced investor would still have had nearly $885,000 after 20 years.
The evidence is clear in the chart below. The timing of your withdrawals matter. If we take the same two investments and extrapolate the last 20 years with an annual withdrawal of $30,000, $50,000, and $70,000, the results are dramatic. A client investing in the S&P 500 over the last 20 years and taking out $70,000 a year would’ve run out of money by 2010!
Source: Morningstar as of Jan. 31, 2020. In CAD. For illustrative purposes only.
Indexes are unmanaged and cannot be invested in directly. Past performance is not indicative of future returns.
Solving the case
Many investors only worry about risk after they lose money, not before. They base their investment decisions on what may be attractive numbers, but don’t consider how much risk they’re taking. That’s why the role of an advisor is crucial. If you happen to retire at a bad time in the markets, because you reached your desired retirement age or because you were forced into early retirement, you will most likely need to tap your nest egg. When you withdraw funds from an investment during a period of decreasing returns, it has a reverse compounding effect. This is the value of diversification. It can help smooth out returns in volatile times. A diversified portfolio such as the one shown has exposure to a variety of asset classes as well as regions. History has demonstrated that some asset classes are going to do well when others lag.
The bottom line
Albert Einstein once said, “compound interest is the eighth wonder of the world. He who understands it, earns it; he who doesn’t it, pays it.” The earlier we save, the better. Unfortunately, the same math is true when you withdraw money during market downturns. Losing less on the way down will result in a better outcome. The next time you have any investor ask you why their portfolio didn’t beat the S&P 500, feel free to say, You’re welcome!
1 As defined by the Russell 1000® Index, a broad measure of U.S. large cap securities.
2 Annualized return as of 12/31/2019. U.S. Equity Large Cap – Russell 1000® Index. Balanced: 20% U.S. large cap (S&P 500 Index), 20% Canadian equity (S&P/TSX Composite Index), 20% international equity (MSCI EAFE Index) and 40% Canadian fixed income (Bloomberg Canada Aggregate Index). Based on past index performance and not indicative of future returns. Indexes are unmanaged and cannot be invested in directly. Index performance does not include fees and expenses an investor would normally incur when investing in a mutual fund. Diversification and strategic asset allocation do not assure profit or protect against loss in declining markets.