The hidden costs of carrying cash
Why are investors incentivized to hold cash? We believe this is partly a result of today's lower bond yields. In addition, market volatility and greater geopolitical risk have made cash look even more attractive to some investors.
So, what’s the problem?
To see the underlying problem, let’s take a step back and look at the net of inflation return on cash. Once you do, the siren call of cash begins to fade. For many, cash equals certainty. But the comfort of having this certainty in return may come at a cost. There are hidden drags that can have a significant impact on the amount of wealth investors ultimately accumulate.
Hidden costs: Inflation versus purchasing power
One cost is inflation, it represents the increase in an item’s purchasing price. When we make an investment, our hope is for our money to grow so we wind up with more money, so we can buy more things down the road. This second factor is known as an increase in purchasing power. But they are two sides of one coin—how much extra purchasing power we end up with (i.e. how much more we can buy) depends on the role that inflation plays along the way.
Here’s a simple example to illustrate the impact inflation can have: say we’re looking to purchase a new flat screen TV. After shopping around, we decide on a beautiful, 76’’ LED TV that costs $1000. Being a prudent investor, we consider 2 potential options:
- A. Buy the TV today for $1000
- B. Wait 1 year to buy the TV and invest the $1000 in a Guaranteed Investment Certificate (GIC) to earn 1% over the next year
Since we don’t need the TV today, we decide to go with option B and wait until next year to purchase the TV while making some extra money. After investing $1000 in a GIC earning 1%, we earn $10 over the next year and our investment grows to $1010. Are we better off? That depends on the impact that inflation has had over the year.
Here’s what could happen:
Scenario 1: Inflation is less than 1%
- The price of the TV in one year will be less than $1010
- Since saving and investing resulted in a larger amount than the new cost of the TV, we have additional money left over after buying the TV
- Our purchasing power has increased
Scenario 2: Inflation is exactly 1%
- The price of the TV in one year will be equal to $1010
- The price of the TV = the amount we have after one year of saving and investing
- Although we earned $10 on our investment, since the price of the TV also increased $10 we will still have only enough money to only buy the TV
- Our purchasing power has stayed the same
Scenario 3: Inflation is more than 1%
- The price of the TV in one year will be greater than $1010
- We no longer have enough money to buy the TV with our savings and investment. We must either take money from other sources to buy the same TV or find a cheaper option
- Our purchasing power has decreased since we can buy less with our money than before
The real return on an investment
The idea of evaluating investment results after the effects of inflation is known as looking at the real return on our investment. This is the return that is most meaningful for investors since this tells you how much your purchasing power has gone up or down.
If our real return on an investment is zero, we are keeping up with inflation, but our purchasing power remains the same. If our real return is positive, we are earning more than inflation and we can buy more goods down the road. Obviously, this is the desired result for investors.
Purchasing power risk
But if scenario 3 happens, our real returns turn negative when inflation is higher than the returns on our investments and purchasing power decreases. This can have significant consequences for investors at or near retirement.This is known as purchasing power risk and represents the risk that prices go up by more than the amount you’ve earned from saving or investing.
Although we may have technically made money by investing, we have lost the ability to purchase the item we originally wanted to buy. It may be easy to live without a brand new 76’’ flat screen TV, but what if you’re simply looking to keep up with the lifestyle you’ve grown accustom to when you are retired?
Beware of the corrosive nature of inflation
We believe most investors need to be aware of inflation and the impact it can have.
It is an important thought to keep in mind when considering cash-like investments. Often, attractive stated rates of return are significantly reduced—or even result in negative real returns—after taking inflation into account.
Looking back to 1991, the chart below shows that 1-year Guaranteed Investment Certificate (GIC) returns have been trending downward. More recently, due to low interest rates, GICs have delivered negative real rates of return over various periods.
Click image to enlarge
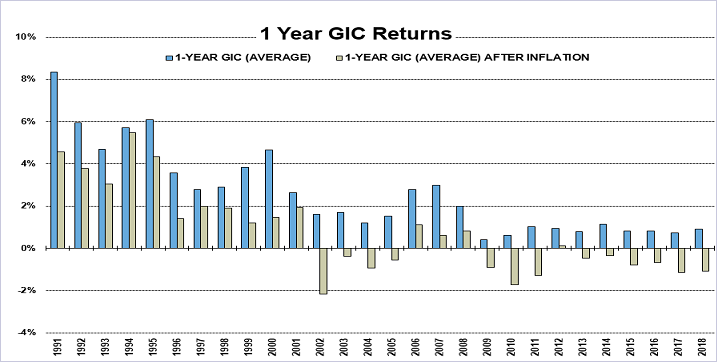
Source: Bank of Canada and Russell Investments
These potential scenarios can create a real dilemma for investors who desire the certainty that a cash-like investment with a pre-stated rate of return can offer. They don’t like the idea of taking risk in the market yet run the risk of losing their purchasing power by owning cash due to inflation.
What’s the solution?
We believe a potential solution for those investors with longer-term time horizons could be a diversified portfolio consisting of historically lower-risk investments such as fixed income, and asset classes that have done well in periods of rising inflation environments such as stocks and real estate.
The chart below shows how a blended index allocation consisting of 80% fixed income, 16% equity and 4% real assets has performed annually compared to returns from 1-year GICs after accounting for inflation.
Click image to enlarge
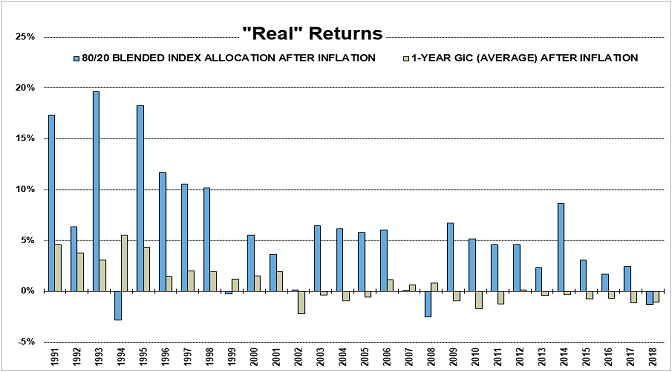
Source: Russell Investments. 80/20 Blended Index Allocation=80% FTSE TMX Canada Universel Bond Index (fixed income) 6% S&P/TSX Composite Index (Canadian equities), 10% MSCI World (global equities), 2% S&P Global Infrastructure Net Index (infrastructure)*, 2% FTSE EPRA/NAREIT Developed Index Net TRI (real estate)**. Indexes are unmanaged and cannot be invested in directly. Past performance is not indicative of future results.
*Prior to November 30, 2001 UBS Global Infrastructure and Utilities Index
**Prior to March 31, 2005 FTSE EPRA/NAREIT Developed Index
The chart demonstrates that by willing to accept a higher level of risk, the Balanced Index Allocation typically has delivered returns far superior to GICs on an annual basis. In addition, although the Balanced Index Allocation experienced more volatility, after inflation, GICs have shown more instances of negative real returns – and therefore a loss of purchasing power – than a diversified allocation to equities, fixed income, and real assets. This idea introduces a more important concept for investors to think about when making investment decisions: The risk of possibly losing money vs. the risk of running out of money.
Bottom line
We recommend investors work with a financial advisor to determine their cash needs for the immediate future and for developing a plan to invest in a globally diversified, multi-asset portfolio for their long-term investment needs.
For advisors, sometimes we forget about we can control—or least help control—is investor behavior. We’ve previously written about how addressing the investment behavior of your clients may be the greatest value you provide. And when it comes to delivering value, avoiding behavioral mistakes is a significant contributor to total value while helping your clients reach their desired outcomes.