$20 billion club: It's been a minute since we've seen numbers like this…
We just finished up our annual report on the $20 billion club, and we've concluded that 2022 was a weird year for pension plans. We are accustomed to seeing things move slowly, in fairly predictable ways. There may be blips along the way, but generally trends continue. The year 2022 may have turned the new normal on its head.
Let me share a few examples of things we observed with the 20 sponsors that have the largest global pension liabilities of US-listed companies.
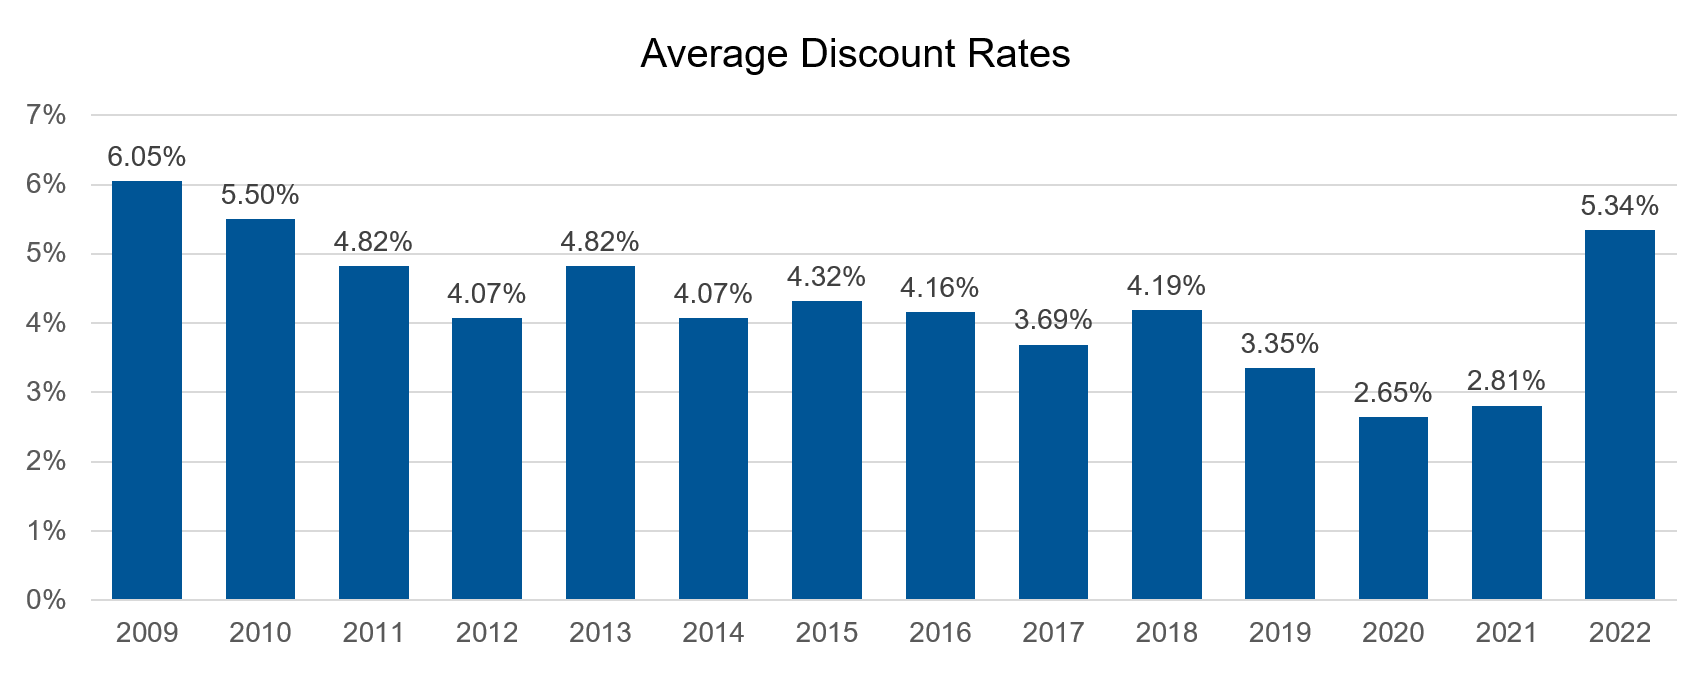
Discount Rates jump above 5%
Last seen: 2010
As the Fed raised rates by 400 bps in 2022, corporate bond rates reacted. While every DB plan was different depending on the yield curve they used and the duration of their liabilities, on average, discount rates for this group increased by 250 bps!
It's getting to the point where accounting discount rates are close to where funding discount rates have been for the last several years. Relatively high rates have been persistent so far in 2023, but this could change quickly.
Click image to enlarge
Source: Corporate 10-k filings, Russell Investments calculations
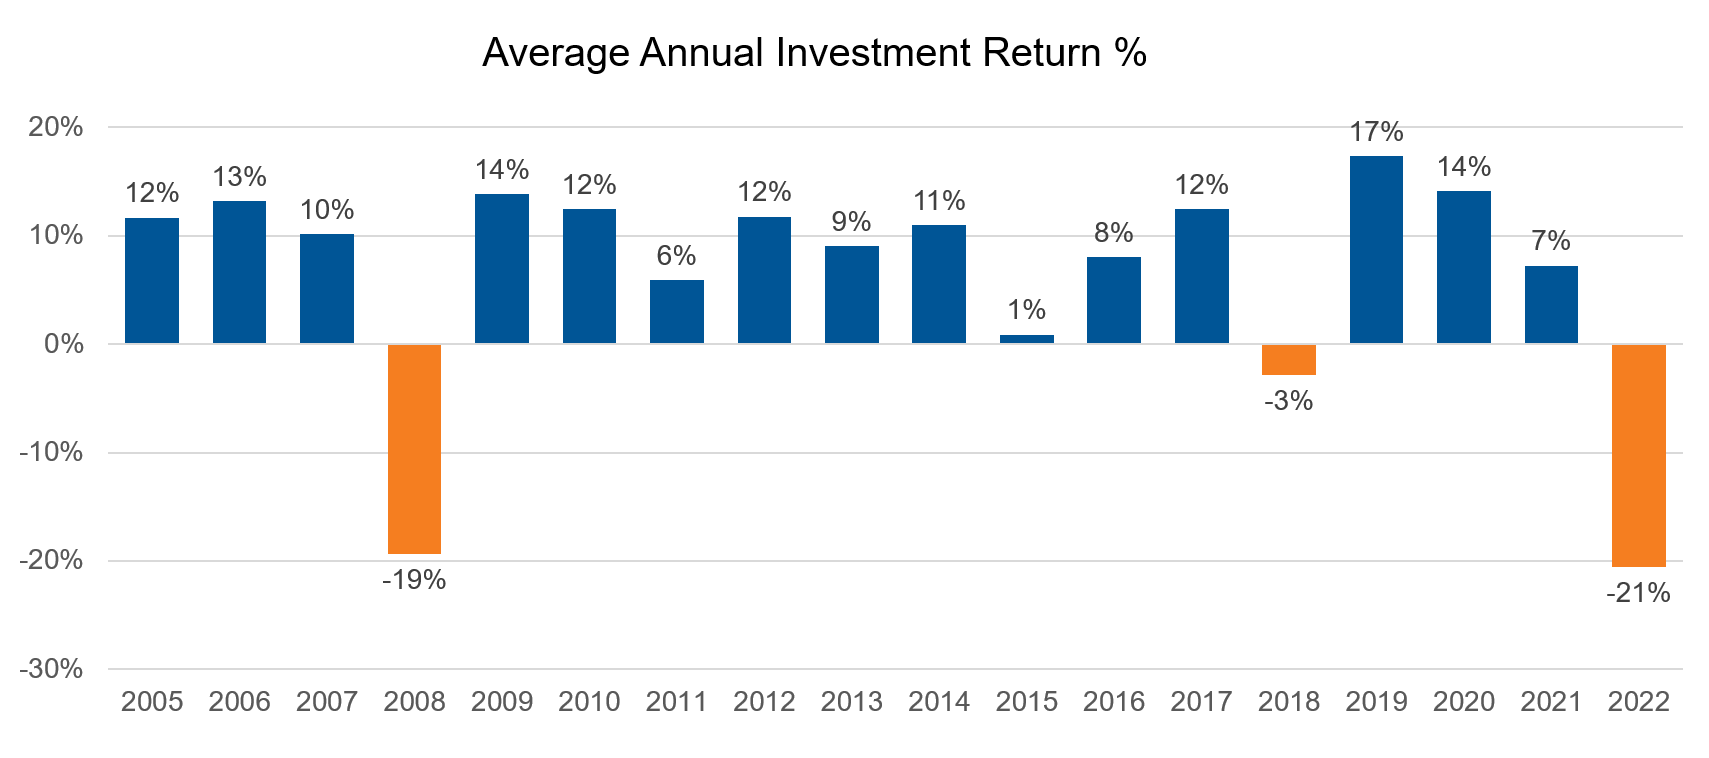
Investment Return of negative 21%
Last seen: Never?
With the exception of a short-term dip in the markets in 2018 and a lackluster annual return in 2015, we have enjoyed robust asset returns over the last 14 years. This has helped to offset the impact of falling rates and rising liabilities over time, and for some plan sponsors, it has helped boost funded status higher. This all changed in 2022, with an average loss of 21% among this group's plan assets. This was worse even than 2008 for total plan assets. Nearly every asset class lost ground in 2022, and if it were not for an equally historic rise in rates, funded status would have catastrophically deteriorated, as we saw in 2008.
As we have discussed repeatedly in this blog, the investment return in isolation should not be the primary focus of corporate DB plan sponsors. Investment returns on their own do not determine funded status, contribution requirements, or PBGC premiums. Sponsors are increasingly focused on how the assets and liabilities move together, and the managing of that interaction is paramount.
Given the elevated level of discount rates, now may just be the right time to get your LDI assets to work harder for you by increasing your plan's hedge ratios, to help protect against another drop in interest rates.
Click image to enlarge
Source: Corporate 10-k filings, Russell Investments calculations
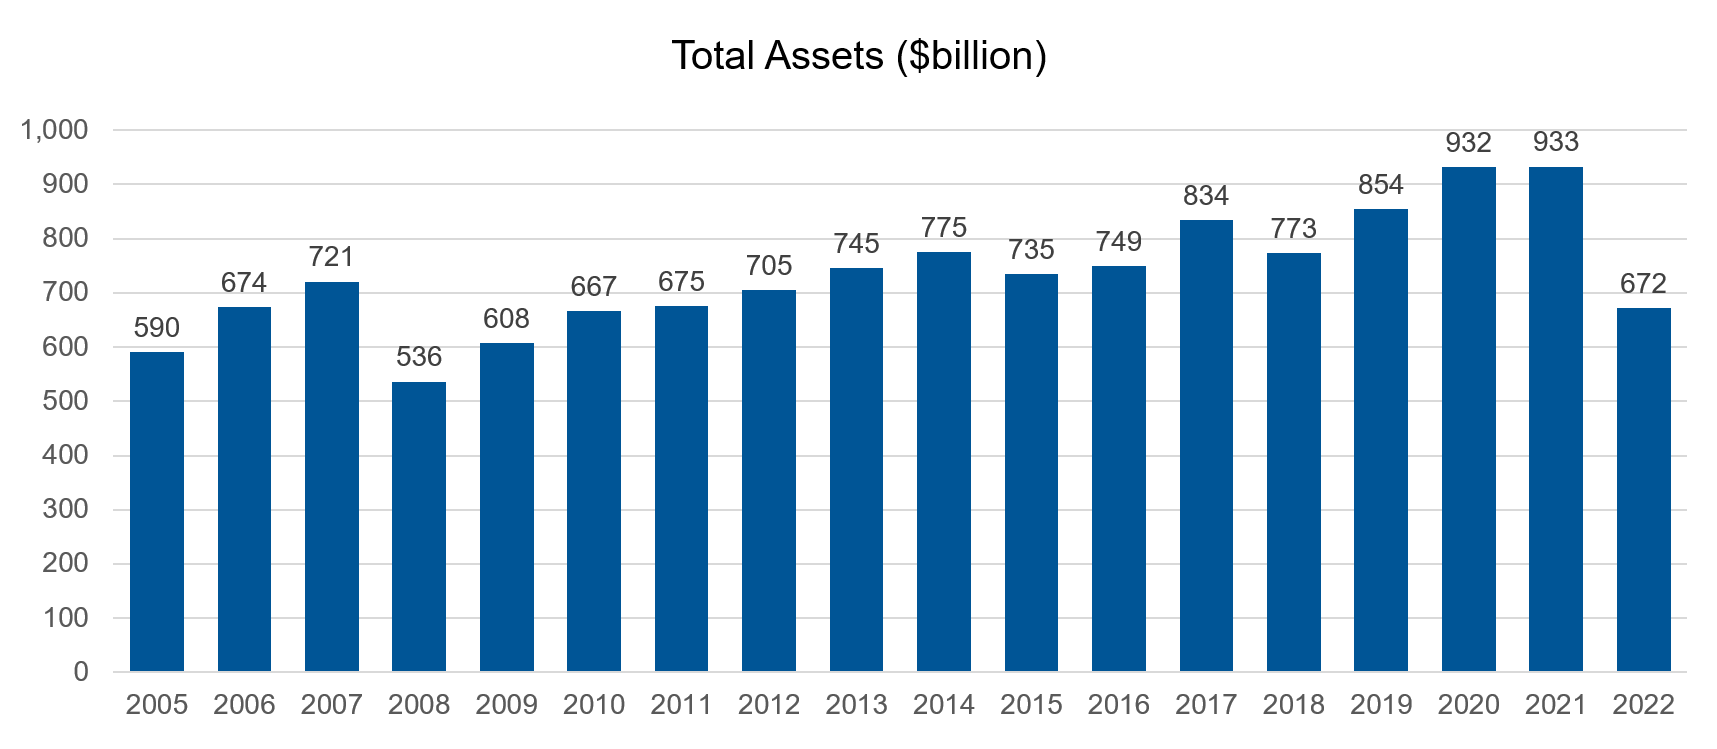
Total Assets below $700 million
Last seen: 2011
On a related note, the absolute value of assets for this group dropped to levels we haven't seen in over ten years. Both equity and fixed income assets did poorly in 2022. The fall in asset values is a combination of the effects of asset returns, expenses (including PBGC premiums), and benefit payments, including some large pension risk transfers (such as IBM's $16 billion transfer in 2022). Assets had otherwise been making steady progress upward since 2008, despite a large number of risk transfers since then.
Unlike 2008, the last time assets dropped dramatically, liabilities also dropped at the same time.
Click image to enlarge
Source: Corporate 10-k filings, Russell Investments calculations
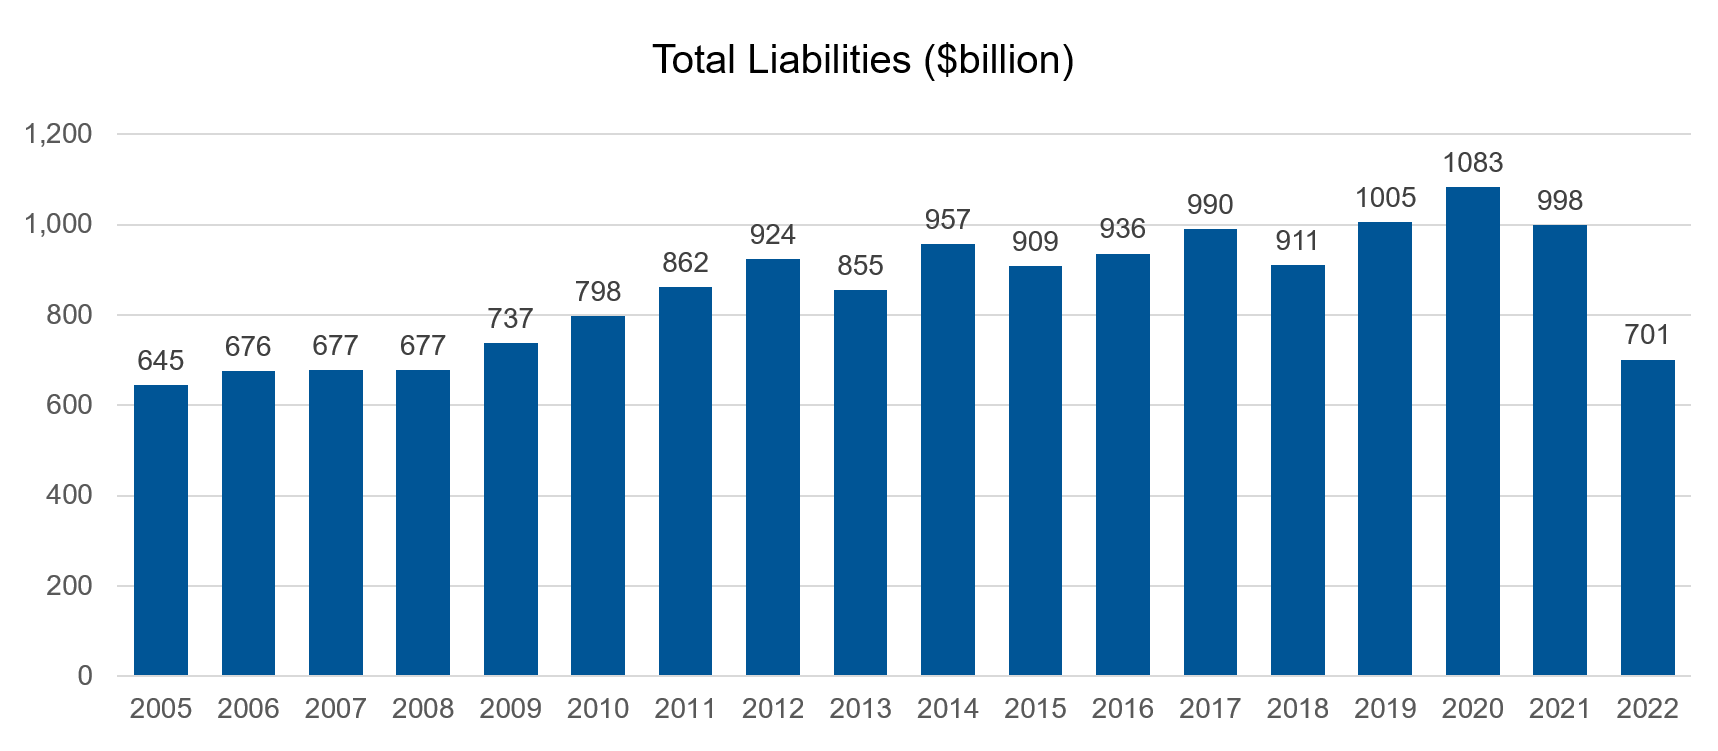
Total Liabilities below $725 billion
Last seen: 2008
Over the years, we have talked about how we had possibly reached "peak pension," when the liabilities for this group had supposedly reached their all-time highest level. We could reasonably expect the combined impacts of plans closing, freezing, and maturing to have their effect to reduce pension plans. In addition, annuity purchases have only become more popular, further reducing the size of plan liabilities.
Despite this, rising rates, new interest, and new benefit accruals have been pushing liabilities higher… until now. The 250 bps jump in discount rates seemed to wipe away the last ten years' worth of liability growth all at once. Peak pension could be in the rearview mirror.
Liabilities are exposed to more than just interest rates. Mortality risk is also a factor, and if life expectancies change in the future, liabilities will change. This poses a risk to sponsors. While actuaries do their best to estimate future life expectances, circumstances can change, and sponsors hold this risk unless or until they engage in a de-risking arrangement with an insurer.
Click image to enlarge
Source: Corporate 10-k filings, Russell Investments calculations
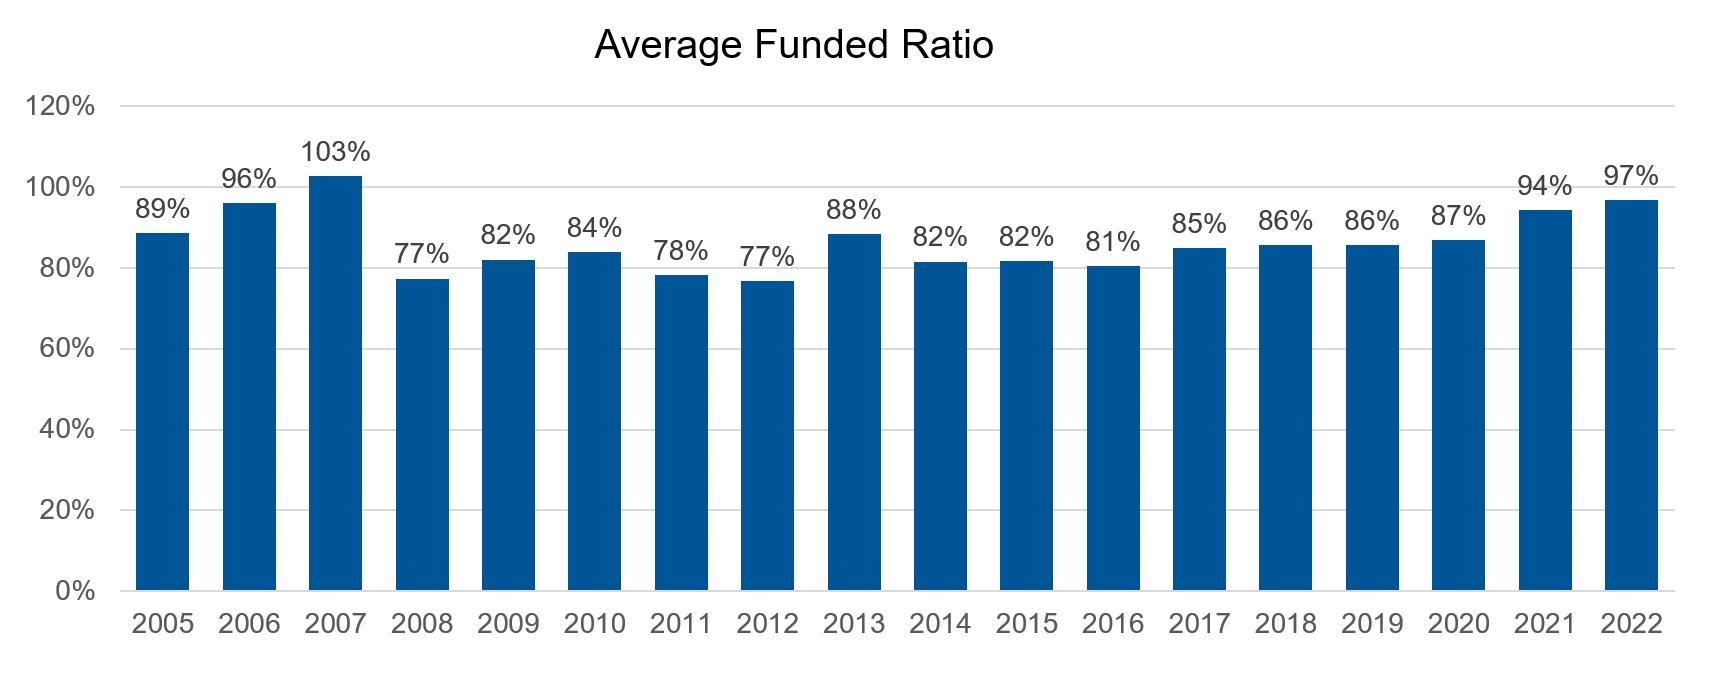
Funded status of 97%
Last seen: 2007
Among this group, funded status dropped significantly in 2008 on the heels of the Global Financial Crisis. Since then, the funded status changes have been more muted. In 2013 we saw a jump before mortality changes, and falling discount rates pushed the funded status down again. But overall, funded status has been steadily improving.
In 2022 the improvement continued, though perhaps not as much as some industry estimates expected. Most of these 20 companies have aggressively pursued LDI, a strategy that is intended to reduce funded status volatility, which doesn't translate into significant funded status improvement in a rising rate environment. Overall, however, almost every plan we monitored saw funded status improvement in 2022, pushing funded status levels up to about 97%.
Click image to enlarge
Source: Corporate 10-k filings, Russell Investments calculations
Total Contributions below $12 billion
Last seen: Just once (2021) in the last 18 years
Contributions have been volatile over the last 18 years (since we first started tracking this data). We have gone from record-breaking year in 2017 (leading up to tax law changes that could reduce the contribution tax deduction) to new lows just in 2021. The motivations behind these contributions over the years have changed. Some of the largest contributions between 2009 and 2013 were probably driven by contribution requirements in response to both pension law changes with PPA and the large funded status drop after the GFC in 2008. Increasing PBGC premiums also help motivate sponsors to fund up.
As funded status improved and funding relief measures were enacted and extended, contribution requirements lessened, to the point now where very few of these companies have contribution requirements in their US plans, at least for now. The majority of contributions now paid for this group are for unfunded, non-qualified plans for highly compensated employees and for non-US plans with varying funding requirements. Discretionary contributions are quite uncommon in the current environment. The notable exception in 2022 was Exxon, which made an unexpected $4 billion contribution, accounting for nearly 40% of all contributions for this group in the year.
Click image to enlarge
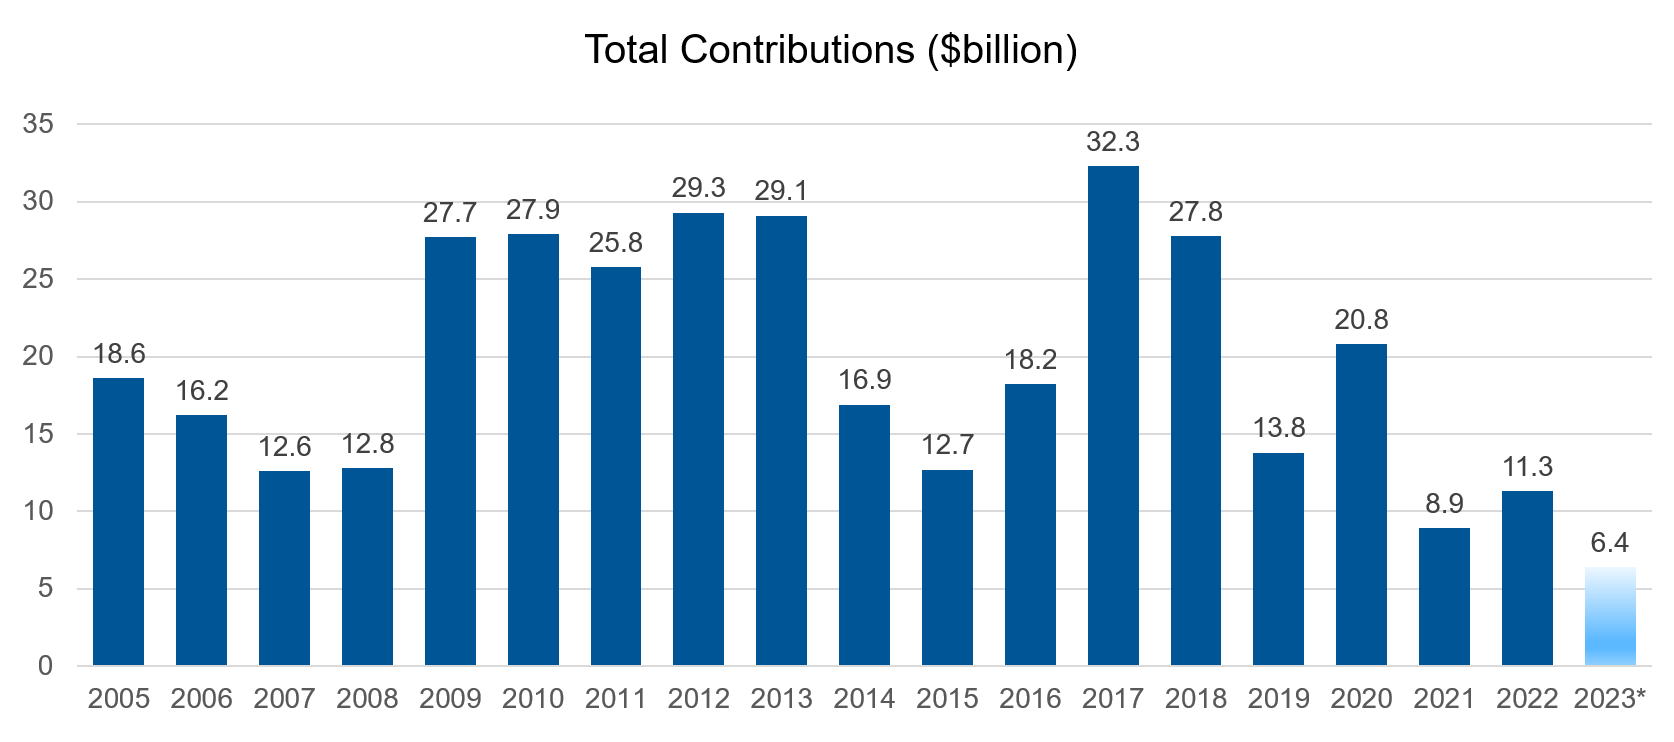
Source: Corporate 10-k filings. 2023 is the sum of all the individual companies expected 2022 contributions.
What may be coming
The year 2022 was noteworthy in many ways, but what will 2023 look like? We plan to provide periodic updates and new insights throughout the year to help everyone keep a finger on the pulse of the US pension landscape. Will discount rates revert to prior levels, or are elevated rates the new norm? Will assets recover? Which company will be the next to pursue a jumbo risk transfer deal?
We look forward to sharing these insights with you in the coming months.