Quarterly Trading Report – Q1 2023: Beware the illiquidity of March
Executive summary:
- The first quarter of 2023 was a tale of two equity markets, with trading volumes down in January and February when compared to the first quarter of 2022 and traders fairly sanguine. The banking crisis in March caused spreads to widen, volatility to rise and ETF volumes to spike substantially.
- The first quarter was very volatile in fixed income, with much speculation into U.S. Federal Reserve (Fed) and terminal rates. The banking turmoil in March led to a hard selloff in financials.
- Liquidity concerns gripped foreign-exchange markets late in the first quarter, with spreads widening by 5 to 10 times the norm in the most liquid currencies.
Q1 2023 Quarterly Trading Report
The first quarter of 2023 was marked by heightened volatility during the banking crisis in March, although the preceding two months were fairly tame. The markets were dominated by the actions of the U.S. Federal Reserve (Fed) and major central banks, the ongoing conflict in Ukraine, a rising-rate environment and a number of bank failures. Market conditions proved quite volatile and tricky to navigate with each rate hike and news cycle bringing new challenges.As societies continue to reopen and economies continue to return to some semblance of yet-to-be-defined normalcy, investors and traders are re-evaluating their positions, risks and their fundamental beliefs.
At Russell Investments, our 24-hour global trading desk accesses over 100 countries globally and covers all asset classes, including equity, fixed income and foreign exchange. With 35-plus years of experience and approximately $2.2 trillion traded annually through our multi-venue institutional platform, the latest trading trends and insights are always at our fingertips. Drawing on this knowledge, here are our key observations from the first quarter of 2023 from the three largest asset classes we trade.
Equities
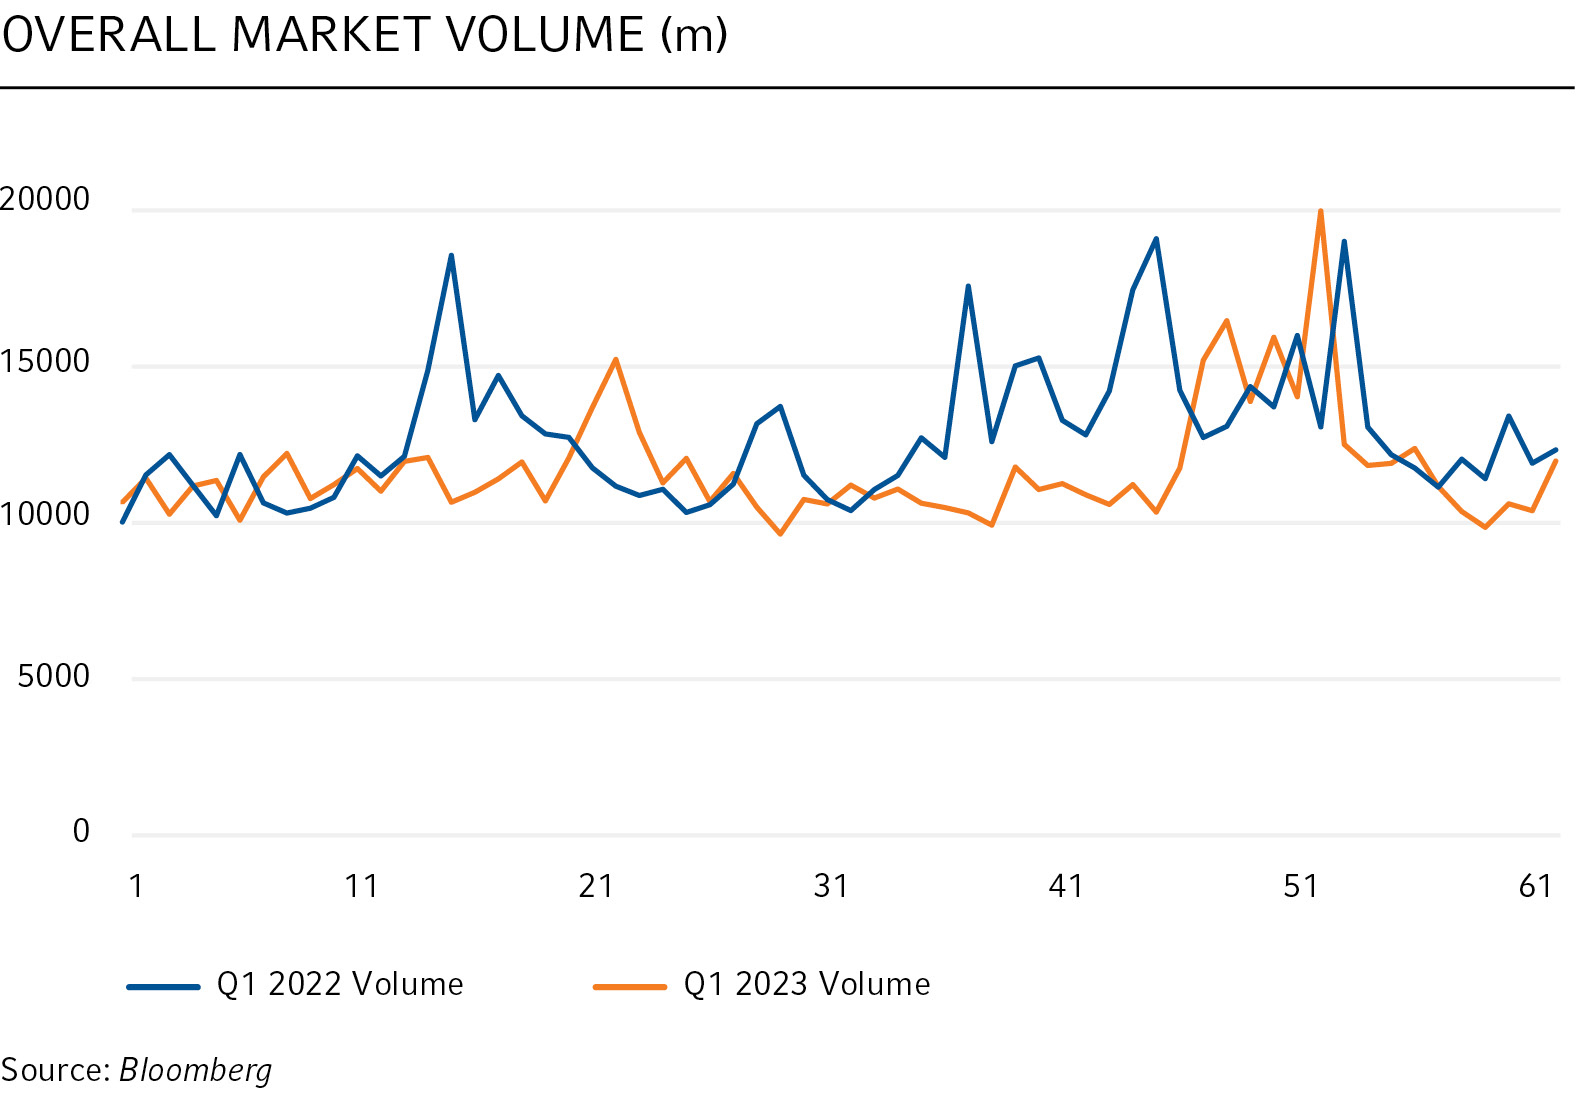
The first quarter of 2023 was a tale of two equity markets. The beginning of the year started out slow, with equity volumes down compared to the first quarter of 2022 and traders fairly sanguine. The script flipped dramatically in March, with the collapse of Silicon Valley Bank and corresponding worries over contagion, bringing back volatility not seen since Russia’s invasion of Ukraine and the early days of the COVID-19 pandemic.
- During this turbulent time, we saw spreads widen and overall volatility rise. Volumes also increased, but with a thinning of liquidity on the inside best bid/best offer market.
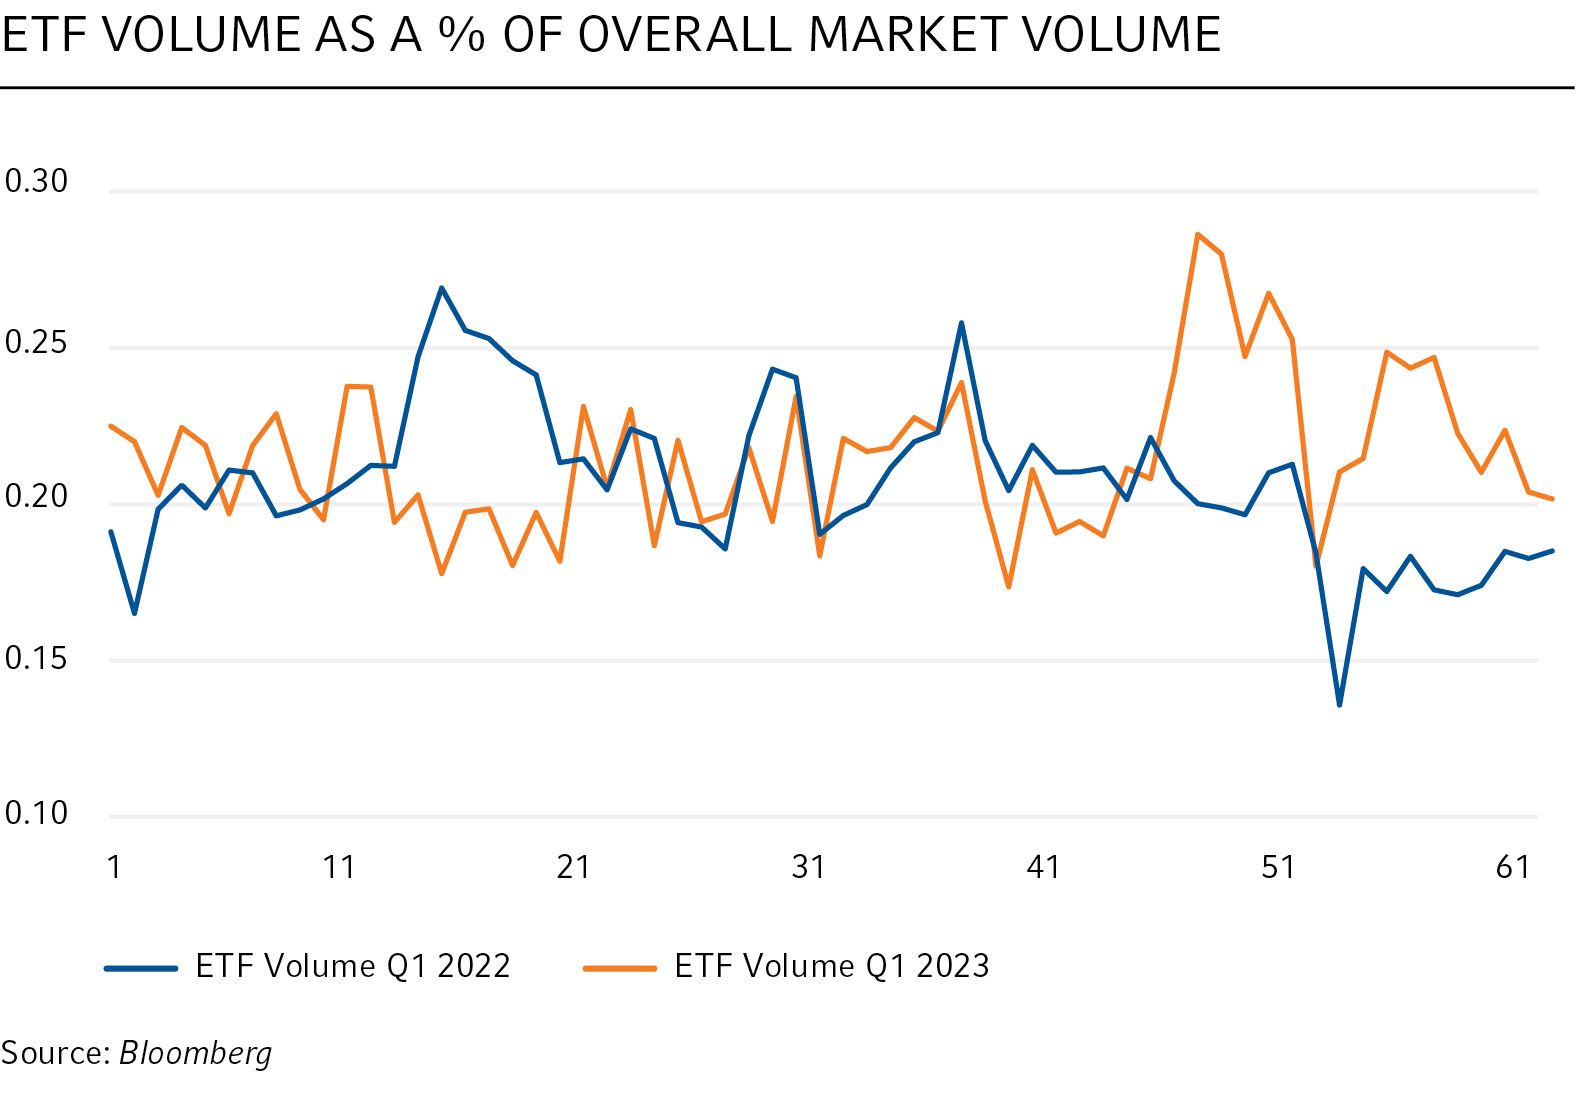
- ETF (exchange-traded fund) volumes also increased during the volatile regional bank episode, spiking substantially.
- While recency bias may suggest that the first quarter was a very volatile quarter, it’s important to understand that this episode lasted about 10 sessions before returning to more normalised levels of volume, spreads and ETF activity
- Overall, equity markets had a positive quarter, led by a very strong rebound in the technology space and growth-oriented industry groups. The S&P 500 Index rose 7%, the Nasdaq Composite Index climbed 16.7% and the Dow Jones Industrial Average eked out a 0.38% gain.
Fixed income
We saw a very volatile first quarter in fixed income, with much speculation into U.S. Federal Reserve (Fed) and terminal rates. This was most evident in the inverted Treasury curve. Investment-grade (IG) credit started the year off strong in January and early February, outperforming with light inventories from the street paired with heavier buying from investors.
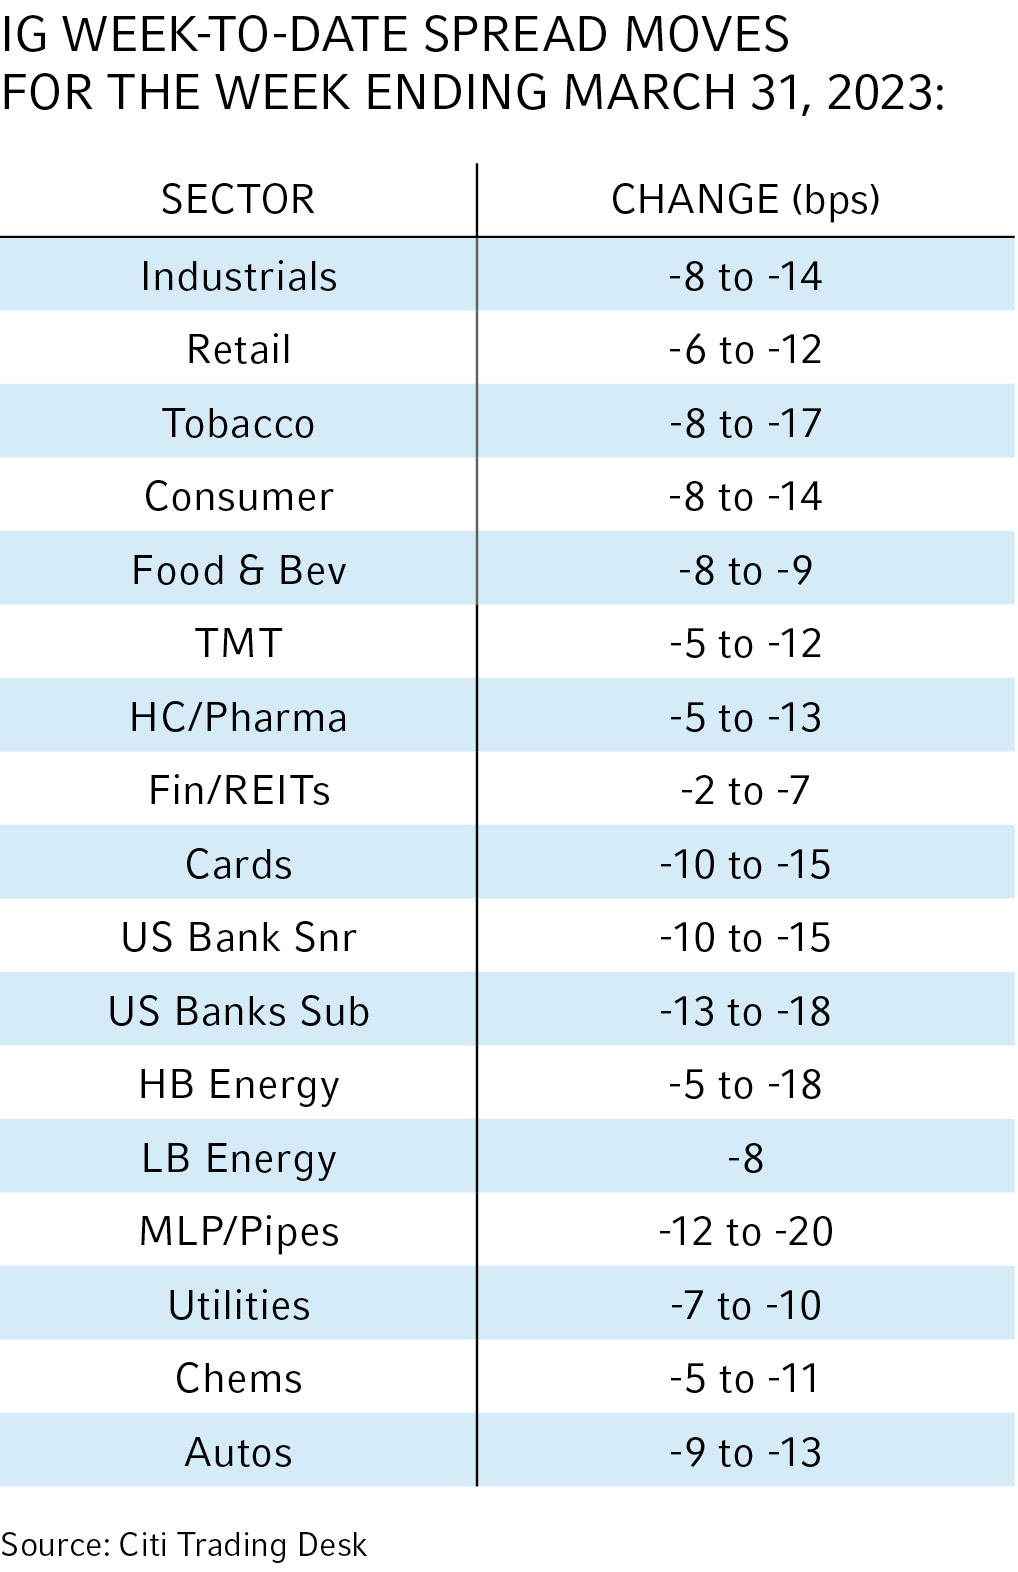
This outperformance was short-lived, however, and led to a complete reversal in early March. Liquidity concerns from the banking sector drove markets for most of March, with a hard selloff in financials. Bid-ask spreads in credit gapped wider by two to three times the normal market conditions. With most risky assets selling off, capital was drastically reduced by market makers, causing a further selloff in credit as it looked for a floor. Continuing its volatile demeanour, markets ended the first quarter by tightening off the Silicon Valley Bank and Credit Suisse restructures. Following continued inflows in IG credit, markets tightened by 20 basis points (bps) in the past few weeks, led by financials, energy, and technology.
Other key highlights:
- Financial spreads remain elevated, with subordinated financials (subs) trading at one-year wides.
- Large swings in credit spreads continued, ranging from 35-85 bps, depending on sector.
- Financials subs continued to underperform, with lows near 245 at one point. As of March 31, 2023, they are at 235. At one point, there was a huge swing of 85 bps due to turmoil in the banking sector.
- Consumer staples had the tightest range and volatility over the first quarter at 32.3 bps, sitting just outside of the average of 140. At quarter-end, they were at 143.
- While January saw a tightening of 14 bps, February and March brought about a reversal, with year-to-date at +5 bps.
- IG (investment-grade) funds saw nine straight weeks of inflows. In short-duration funds, only the IG segment saw outflows.

Foreign exchange
Due to the multiple large macro events occurring in the last three years—the COVID-19 pandemic, the Russia–Ukraine war and coordinated rate hikes among central banks—liquidity has been a hot topic in currency markets. Late in the first quarter, it bubbled to the surface once more as turmoil gripped the banking sector.
- Similar to the previous events, at the peak panic point during the banking crisis, liquidity in the most liquid currencies was dire—despite a spike in volumes. Case-in-point: Spreads widened by 5 to 10 times the norm.
- Anecdotally, during the early days of the pandemic in March 2020, for EUR/USD—the most liquid currency pair—it took over an hour for a small size of just €10 million to clear/unwind.
- During these peak periods, our FX trading desk was able to maintain a spread cost below half a basis point.
- This is a result of having the option to execute on multiple electronic venues with over 20 major banks that we have established a strong relationship with over two decades. These banks show us axes and tight rates. Our low spread cost is also attributed to having the ability to tap into 50 liquidity providers’ books to examine the current market spread, which helps us make educated decisions on how to trade in these erratic and volatile markets.

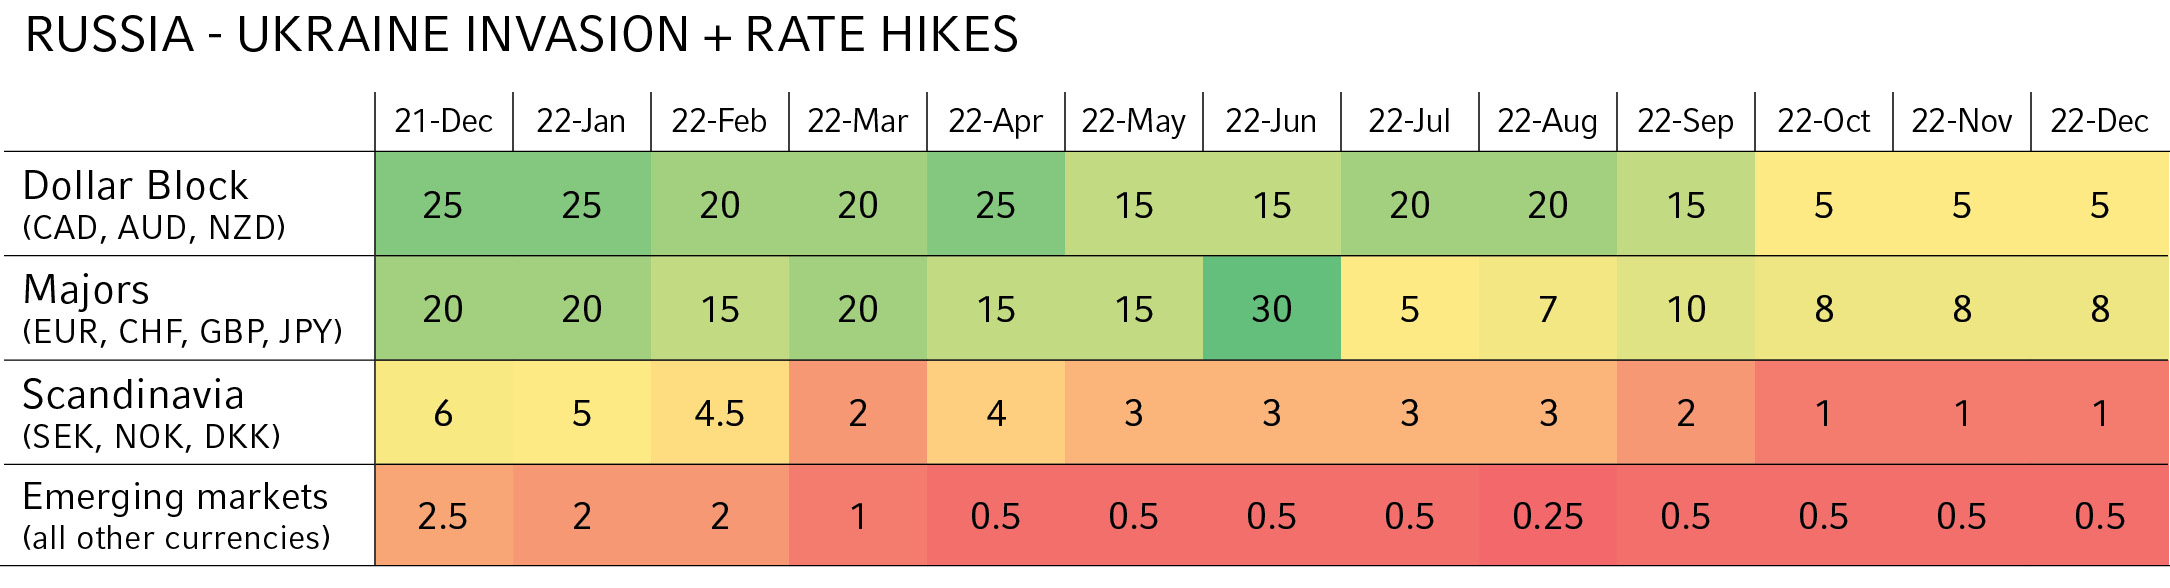
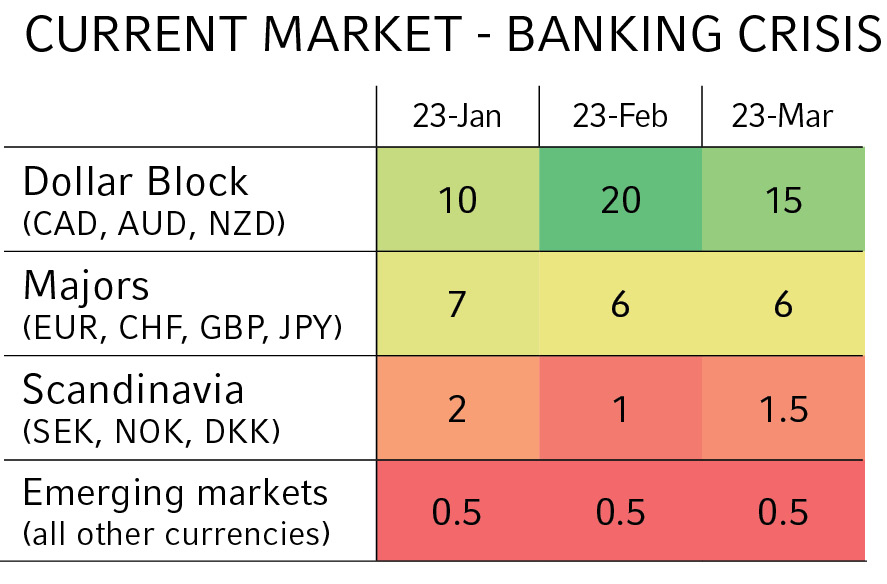
Colors represent levels of liquidity. Green is more liquid, and red is less liquid. Numbers, in USD millions, represent the amount traded in one clip. They are approximate figures only.
The bottom line
Large, volatile events like the banking crisis in March drive market speculation, underscoring the need for access to many different forms of liquidity to help reduce impact, lower transaction costs and provide better execution.
At Russell Investments, our trading desk has access to 400 dealers globally for direct execution, which helps minimise transaction costs and market exposure and improve execution. We also incorporate electronic trading of live interdealer markets, request for quote platforms and anonymous all-to-all dark pools. This creates a wealth of access to natural liquidity for our transition management and execution services clients—even under the worst of conditions.
While it appears that the worst of the banking crisis is likely in the rearview mirror, our 35-plus years in the business have taught us that volatility is never too far away. At Russell Investments, we believe it’s best to always be well-prepared in advance of the next storm. A large part of this means keeping our pulse on the latest trends in the trading industry. We look forward to continuing to share our observations and insights with you every quarter.