2018 capital gains: Adding insult to injury
Investors are likely looking at their portfolios and trying to determine how the volatile fourth quarter impacted their returns and how it impacted progress toward their financial goals. Having the market (Russell 3000® Index) pull back -14% in a single quarter and drop -5% for the year is tough, but for taxable investors, the possible tax hit will add insult to injury.
Morningstar U.S. OE Mutual Funds and ETFs. % = Calendar Year Cap Gain Distributions / Year-End NAV. For years 2001 through 2013, used oldest share class. 2014 forward includes all share classes. Indexes are unmanaged and cannot be invested in directly. Returns represent past performance, are not a guarantee of future performance, and are not indicative of any specific investment.
How can there be a tax owed when an investment goes down?
Mutual funds are required to payout 98.2% of realized capital gains back to shareholders within their fiscal year. If the mutual fund has unused losses from prior years (capital loss carryforwards), it may be able to offset some - or all - of the gain depending on size of the loss carryforward. Given that U.S. stock markets had positive returns for nine consecutive years coming out of 2008 plus the first three quarters of 2018, hardly any U.S. equity funds had any available losses to use against recognized gains.
Additionally, 2018 was a record year for selling pressure on U.S. equity funds, as investors expressed concerns about high valuations and/or moves to passive investing.This selling pressure caused many portfolio managers to sell securities that had low cost basis. Again, U.S. stocks were up cumulatively 340% from January 2009 - December 2018.1 Odds are they had to sell low basis securities that triggered gains.
The pullback during the fourth quarter, where stocks were down -14%, pushed 2018 to have a calendar year return of -5%. So, the aforementioned selling pressure happened in a year when equity markets were down.
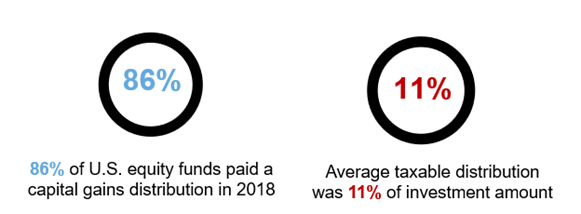
When we looked broadly across all products within the Morningstar U.S. equity universes (large, small, mid, active, passive, ETF's, etc.), 86% of the products paid a capital gain distribution for 2018. 2 This is up from 2017, when the number of funds with a distribution was 65%.3
And for those that paid the capital gain distribution, the average payout was 11% of net asset value of the fund. Think about that. Equity markets were down -5% for the year and taxable investors will be receiving an average distribution of 11% on the value of their investments. Being an average, that means there were many with amounts much higher and lower than the average. Definitely a time when being above average was not optimal. And this 11% distribution amount is the highest number we've seen since we've been tracking back to 2001.
Note also that - on average - 16% of the capital gain distribution was characterized as short-term capital gain. Why does this matter? Short-term capital gains are taxed as ordinary income and can have materially higher tax rates than long-term capital gains - depending on one's tax bracket.
The math of taxes: up year vs. down year
In 2017, the markets were much kinder to investors and the tax hit maybe did not feel as punitive. The average distribution was 8% and U.S. stocks were up 21%. Many investors are (incorrectly) less bothered paying a tax when markets are up, because they feel like they made money. The exhibit below shows the math for taxable investors comparing 2017 to 2018.
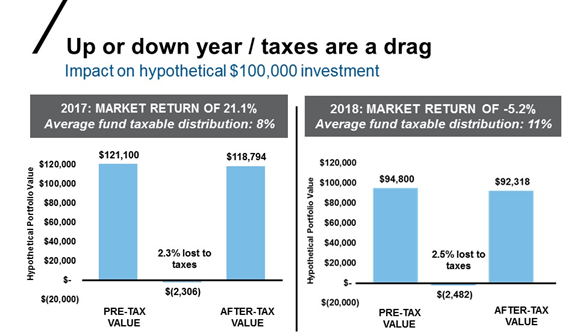
FOR ILLUSTRATIVE PURPOSES ONLY. As of 12/31/2018. Calculation methodology: Assumed starting hypothetical portfolio value of $100,000. U.S. equity market return applied to starting value to arrive at ending pre-tax value. Percent lost to taxes is the estimated taxes due divided by $100k. This amount is then subtracted from the ending pre-tax value shown to arrive at final after-tax value.
Sources: U.S. equity market return: Russell 3000® Index. Index returns represent past performance, are not a guarantee of future performance, and are not indicative of any specific investment. Indexes are unmanaged and cannot be invested in directly.
Average U.S. Equity Fund Distribution: Capital Gains/Share (% of NAV) based on Morningstar U.S. OE Mutual Funds and ETFs. % = Calendar Year Cap Gain Distributions / Year-End NAV. Distribution is assumed to be made at last day of year and reinvested. Tax rate is 23.8% (Max LT Cap Gain 20% + Net Investment Income 3.8%).
You can see that regardless of the market backdrop, the hypothetical portfolio paid around $2,300 in federal taxes.Again, these are averages (meaning some paid more) and the math also assumes the gains are taxed as long term capital gains.As previously stated, parts of these distributions were short term in nature and would lead to higher tax bills than the amount shown.
The power of being a tax-smart investor is looking to dial down the tax drag every year - regardless of market return.Dialing down the tax hit in a year like 2017 leaves more money in the account to grow the following years and unleash the power of compounding over time.That is the real power of tax-smart investing.
What can you do?
The first thing is for investors to connect the dots between the IRS Form 1099 they receive in January to the investment return one sees on their investment report.Connect the dots for your clients. Even if you reinvest the distribution, it can be taxable. The amount on the 1099 is reducing your investment return.
Next is to focus on tax-smart investment approaches. Tax-managed equity funds are designed to be managed to limit the amount of taxable distributions and work to not sacrifice any investment return. Tax-managed equity funds can look to harvest losses opportunistically throughout the year to create a cushion to be used against future losses. The pullback markets saw in Q4 2018 afforded this opportunity for tax-managed equity funds.
Tax-managed equity funds levers include:
- Active loss harvesting - all year and not just year end
- Manage holding periods: Avoiding/limiting short-term capital gains
- Sources of return: dividends vs. capital appreciation
- Specific tax lot identification for buys/sells
- Tax-smart manager changes to limit tax impact
The bottom line
2018 market results, coupled with larger-than-average capital gain distributions, are coming together to create the (im)perfect storm for advisor discussions in Q1 2019. Advisors need to be ready to explain to their taxable investors why the tax hit when investors also saw negative returns. Will Rogers is attributed with saying, "If you find yourself in a hole, stop digging." If your taxable clients are in tax-inefficient investments, the first thing to stop is making it worse. Don't reinvest the distribution back into the same tax-inefficient investment and evaluate making the choice to switch to a tax-smart investing approach.
1 U.S. stocks represent the cumulative return for S&P 500 for Jan. 2009 through Dec 2018
2 Morningstar U.S. OE Mutual Funds and ETFs. % = Calendar Year Cap Gain Distributions / Year-End NAV. For years 2001 through 2013, used oldest share class. 2014 forward includes all share classes. Indexes are unmanaged and cannot be invested in directly. Returns represent past performance, are not a guarantee of future performance, and are not indicative of any specific investment.
3 Capital Gains: 2018 ICI Factbook.