
The volatile markets of the past week reminded investors that, while
running with the bulls may be exciting, it also can be dangerous. The S&P 500® Index lost -7% in value in the first seven trading days of February, with the MSCI Emerging Markets and MSCI EAFE Index hovering in the same range, at -8% and -6%, respectively. While no one can predict the future, it’s entirely possible that volatility is here to stay.
And yet, the recent bout of volatility barely put a dent into the stretched U.S. equity valuations. At the end of 2017, Robert Shiller’s Cyclically Adjusted Price-to-Earnings ratio (CAPE) stood at 32. By the end of January, following a 6% appreciation in the S&P 500® Index, the CAPE had risen to 34. On February 9, the CAPE was back to where it had started the year. But even at that “reduced” CAPE, U.S. equity valuations still appear expensive.
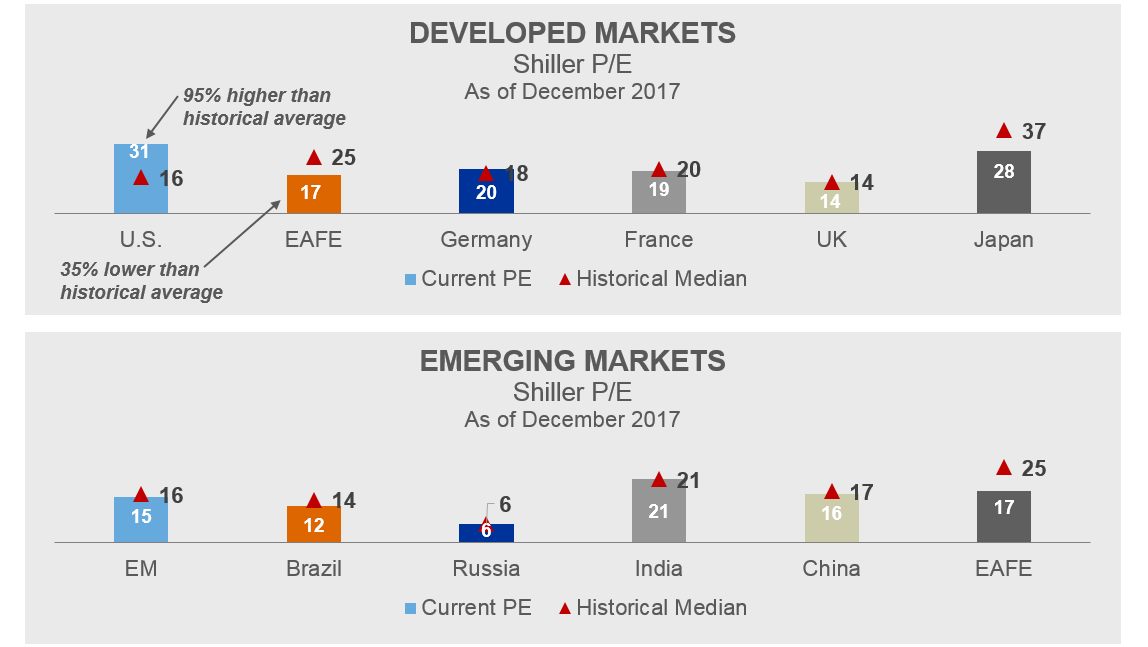
An update of the chart my colleague,
Mike Smith, ran last year illustrates how expensive the U.S. is relative to its own history
and to other international equity markets. At the end of 2017, the U.S. stock market’s valuation exceeded its historical long-term average by 95%. In contrast, non-U.S. developed markets (EAFE) and emerging markets were trading at an approximate 35% discount relative to their historical averages.
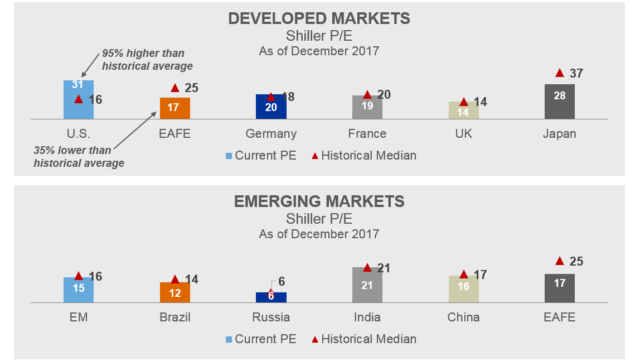
Sources: Shiller P/E data from Robert Shiller website and Research Affiliates website. PE start dates differ: US: 1871; EAFE: 1972; Germany: 1969; France: 1971; UK: 1969; Japan: 1969; EM: 1995; Brazil: 1994; Russia: 1996; India: 1994; China: 1995. All ending with December 2017. Index returns represent past performance, are not a guarantee of future performance, and are not indicative of any specific investment. Indexes are unmanaged and cannot be invested in directly.
As Mike said last year, “This does not bode well for U.S. equity expectations.”
Where to instead?
While valuations do not guarantee a certain return outcome, it is important to consider how expensive an asset is when investing long-term. In that vein, non-U.S. markets may be an investment worth considering for clients with the appropriate risk tolerance.
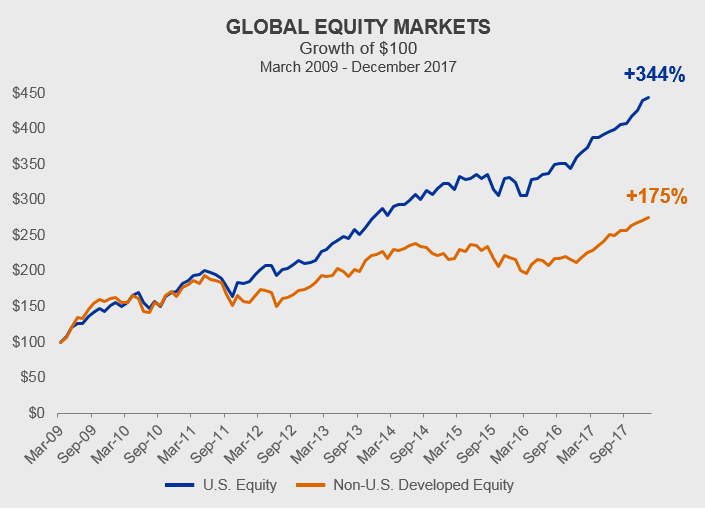
Not only are the valuations outside the U.S. lower, making them more affordable for investors, they have also been part of the post-GFC equity market rally. The chart below shows the growth of $100 (2009-2017) in the U.S. equity market compared to the non-U.S. developed equity market. A $100 investment into U.S. equities in 2009 would have grown to nearly $450 dollars by the end of 2017; in contrast, $100 invested in non-U.S. equities would yield about $275 dollars at year-end 2017. While the U.S. certainly outperformed over this period, hindsight is 20/20, and going forward it’s important to keep in mind how expensive the U.S. equity market is. Given this fact, non-U.S. markets may provide more potential growth over the long-run given their more attractive valuations.

Sources: U.S. Equity — Russell 3000® Index; Non-U.S. Developed Equity — MSCI EAFE Index; Index returns represent past performance, are not a guarantee of future performance, and are not indicative of any specific investment. Indexes are unmanaged and cannot be invested in directly.
The bottom line
We don’t have a crystal ball to predict what will happen in 2018. But U.S. equity markets appear expensive relative to historical averages, and the price paid for an investment can influence future returns. While lower valuations do not guarantee a better return, it may be worth it for long-term investors to look outside U.S. borders to diversify their portfolio.
 Sources: Shiller P/E data from Robert Shiller website and Research Affiliates website. PE start dates differ: US: 1871; EAFE: 1972; Germany: 1969; France: 1971; UK: 1969; Japan: 1969; EM: 1995; Brazil: 1994; Russia: 1996; India: 1994; China: 1995. All ending with December 2017. Index returns represent past performance, are not a guarantee of future performance, and are not indicative of any specific investment. Indexes are unmanaged and cannot be invested in directly.
As Mike said last year, “This does not bode well for U.S. equity expectations.”
Sources: Shiller P/E data from Robert Shiller website and Research Affiliates website. PE start dates differ: US: 1871; EAFE: 1972; Germany: 1969; France: 1971; UK: 1969; Japan: 1969; EM: 1995; Brazil: 1994; Russia: 1996; India: 1994; China: 1995. All ending with December 2017. Index returns represent past performance, are not a guarantee of future performance, and are not indicative of any specific investment. Indexes are unmanaged and cannot be invested in directly.
As Mike said last year, “This does not bode well for U.S. equity expectations.”
 Sources: U.S. Equity — Russell 3000® Index; Non-U.S. Developed Equity — MSCI EAFE Index; Index returns represent past performance, are not a guarantee of future performance, and are not indicative of any specific investment. Indexes are unmanaged and cannot be invested in directly.