Case study: How a currency management strategy can work as a diversifier
Executive summary:
- The ARCS strategy is a currency management strategy that gives a diversified exposure to three factors: Carry, Value and Trend
- This strategy has a low or sometimes even negative correlation to traditional assets. This allows it to enhance multi-asset portfolio returns with modest or no additional risk.
- We believe the future return prospects of ARCS also look decent. This is because two indicators of the strategy's forward-looking return potential have improved in recent years and sit above their historical average. These indicators relate to the ARCS Carry and the ARCS Value factors.
Currency management is an often-overlooked aspect of multi-asset portfolio management. However, investors can potentially add value by incorporating a currency strategy into their portfolio. The challenging experience of 2022 for capital markets, is a case in point. At its low point in October 2022, a 60-40 U.S. stock-bond portfolio had fallen by more than 20% from where it started the year.
In an environment where inflation surged and the U.S. central bank raised interest rates aggressively, bonds did not fulfil their usual diversification function. However, we were able to use our Absolute Return Currency Strategy (ARCS) to deliver diversification to stocks and bonds and generate positive returns as demonstrated in Exhibit 1. The Absolute Return Currency Strategy (ARCS) has been designed as a robust and transparent rules-based strategy which gives a diversified exposure to three factors: Carry, Value and Trend. This strategy has a low or sometimes even negative correlation to traditional assets and thus can enhance multi-asset portfolio returns with modest or no additional risk.
Exhibit 1: Absolute Return Currency Strategy vs U.S. stock and bond return indices
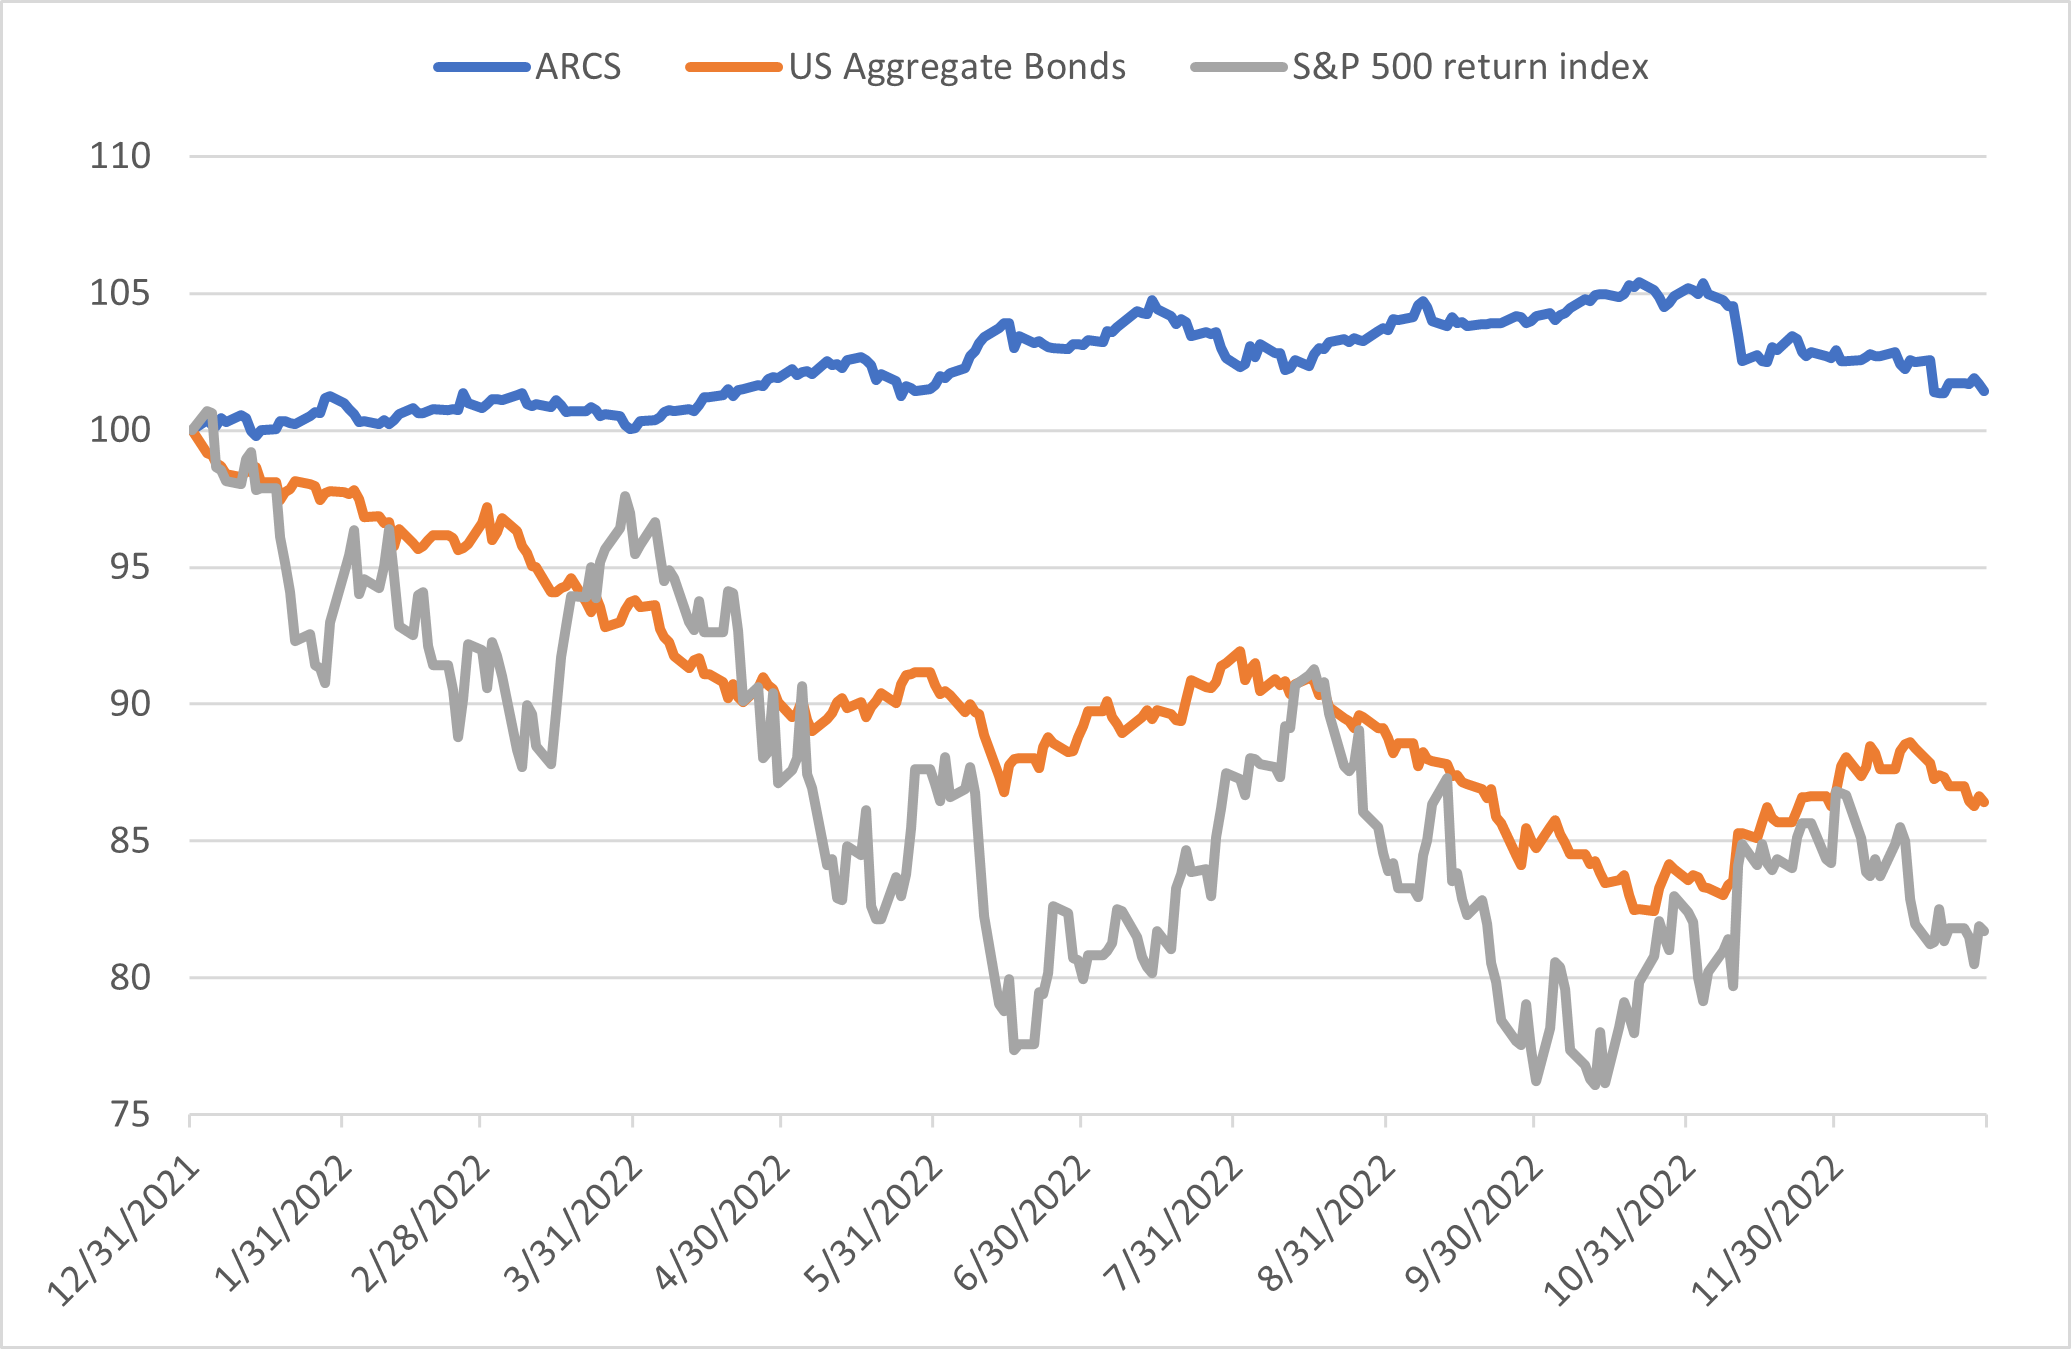
Source: Russell Investments, Refinitiv Datastream, as of 31 December 2022
Throughout 2022, ARCS exhibited negative 12-month trailing correlations with the main traditional asset classes. This was driven by the ARCS Trend factor, as we illustrate in Exhibit 2. As the Federal Reserve embarked on a rapid rate hike cycle, the U.S. dollar (USD) strengthened and established a strong upward trend. ARCS Trend took a pronounced long USD position, especially against the Japanese yen, for much of the year. Traditional asset classes including global and U.S. stocks, credit and bonds fell as the risk-free rate reset to a much higher level in 2022. In Exhibit 2, we see that the 12-month correlation of ARCS Trend became more negative as the economic regime shifted to monetary tightening.
Exhibit 2: Correlation of ARCS Trend factor with asset classes
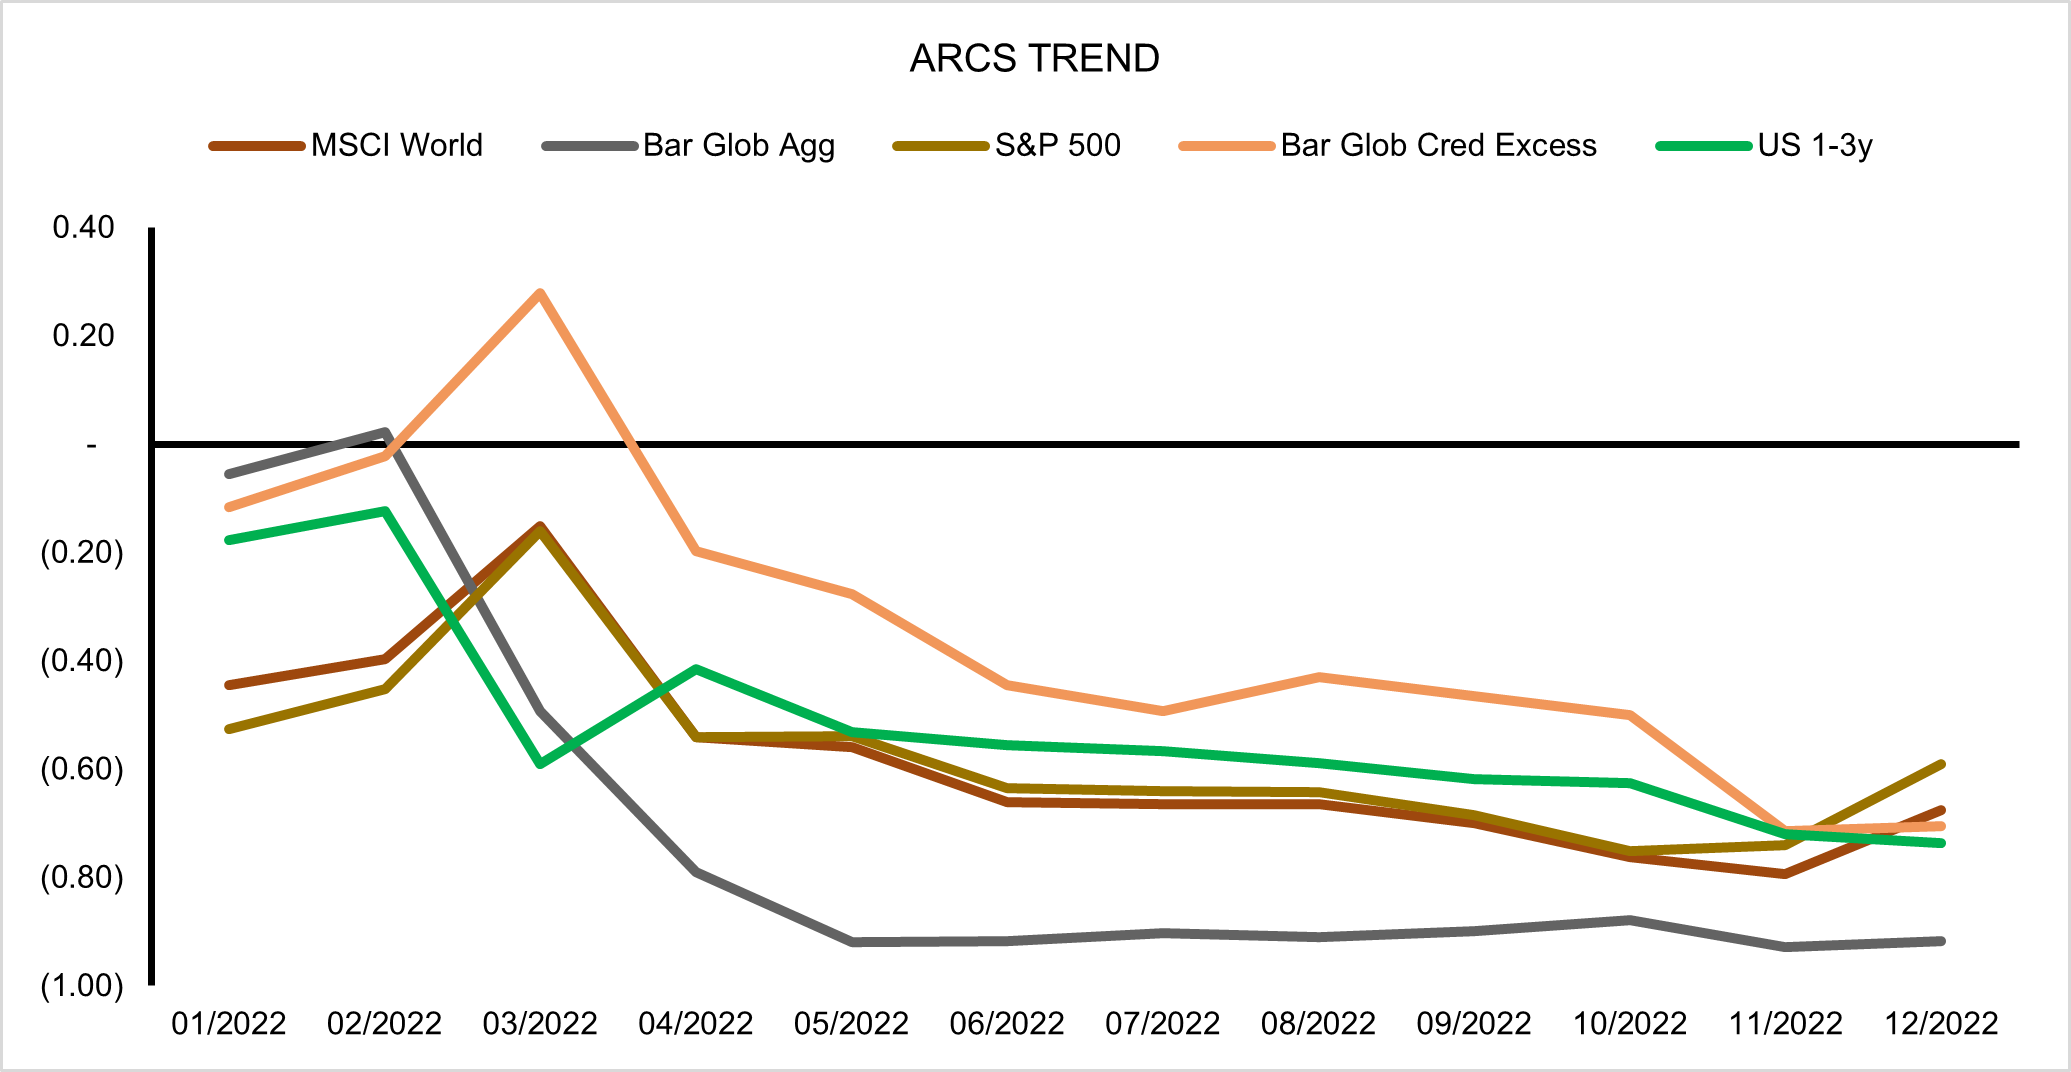
Source: Russell Investments, Bloomberg, as of 31 December 2022
From October 2022 until April 2023, stocks and bonds have recovered somewhat and ARCS Trend has given up some of its strong returns. However, it is gratifying that our currency strategy demonstrated its potential to diversify in a challenging environment for other asset classes. The long-term case for ARCS rests on its potential to generate modest positive return while being uncorrelated to major asset classes. In 2022, we saw how it can even become negatively correlated to stocks and bonds.
Why ARCS now?
In our view, the future return prospects of ARCS also look decent. Two indicators of the strategy's forward-looking return potential have improved in recent years and sit above their historical average. They relate to the ARCS Carry and the ARCS Value factors.
In ARCS Carry, we are long currencies which have the highest short-term interest rates and are short currencies at the opposite end of the rate spectrum. We can define the Carry spread as the difference in annualised interest rates of the long Carry basket and the short Carry basket. If spot exchange rates and interest rates stayed unchanged, the Carry strategy would earn this spread. In Exhibit 3, we plot the Carry spread plotted against its full-sample mean and its 10-year moving average. It turns out that the mean Carry spread of 3.4% is close to the return of the ARCS Carry strategy over the same period. As of the end of April 2023, the Carry spread is at 3.7%, slightly above its full-sample mean and well above its 10-year average of 2.3%. While this is an encouraging medium-term indicator of the return prospects of the ARCS Carry factor, it should be noted that the realized return can deviate significantly from it. Broadly speaking, a rising or stable Carry spread is more beneficial for the Carry factor return than a sharply declining spread (for example, in 2008 or 2020).
Exhibit 3: Carry spread and averages
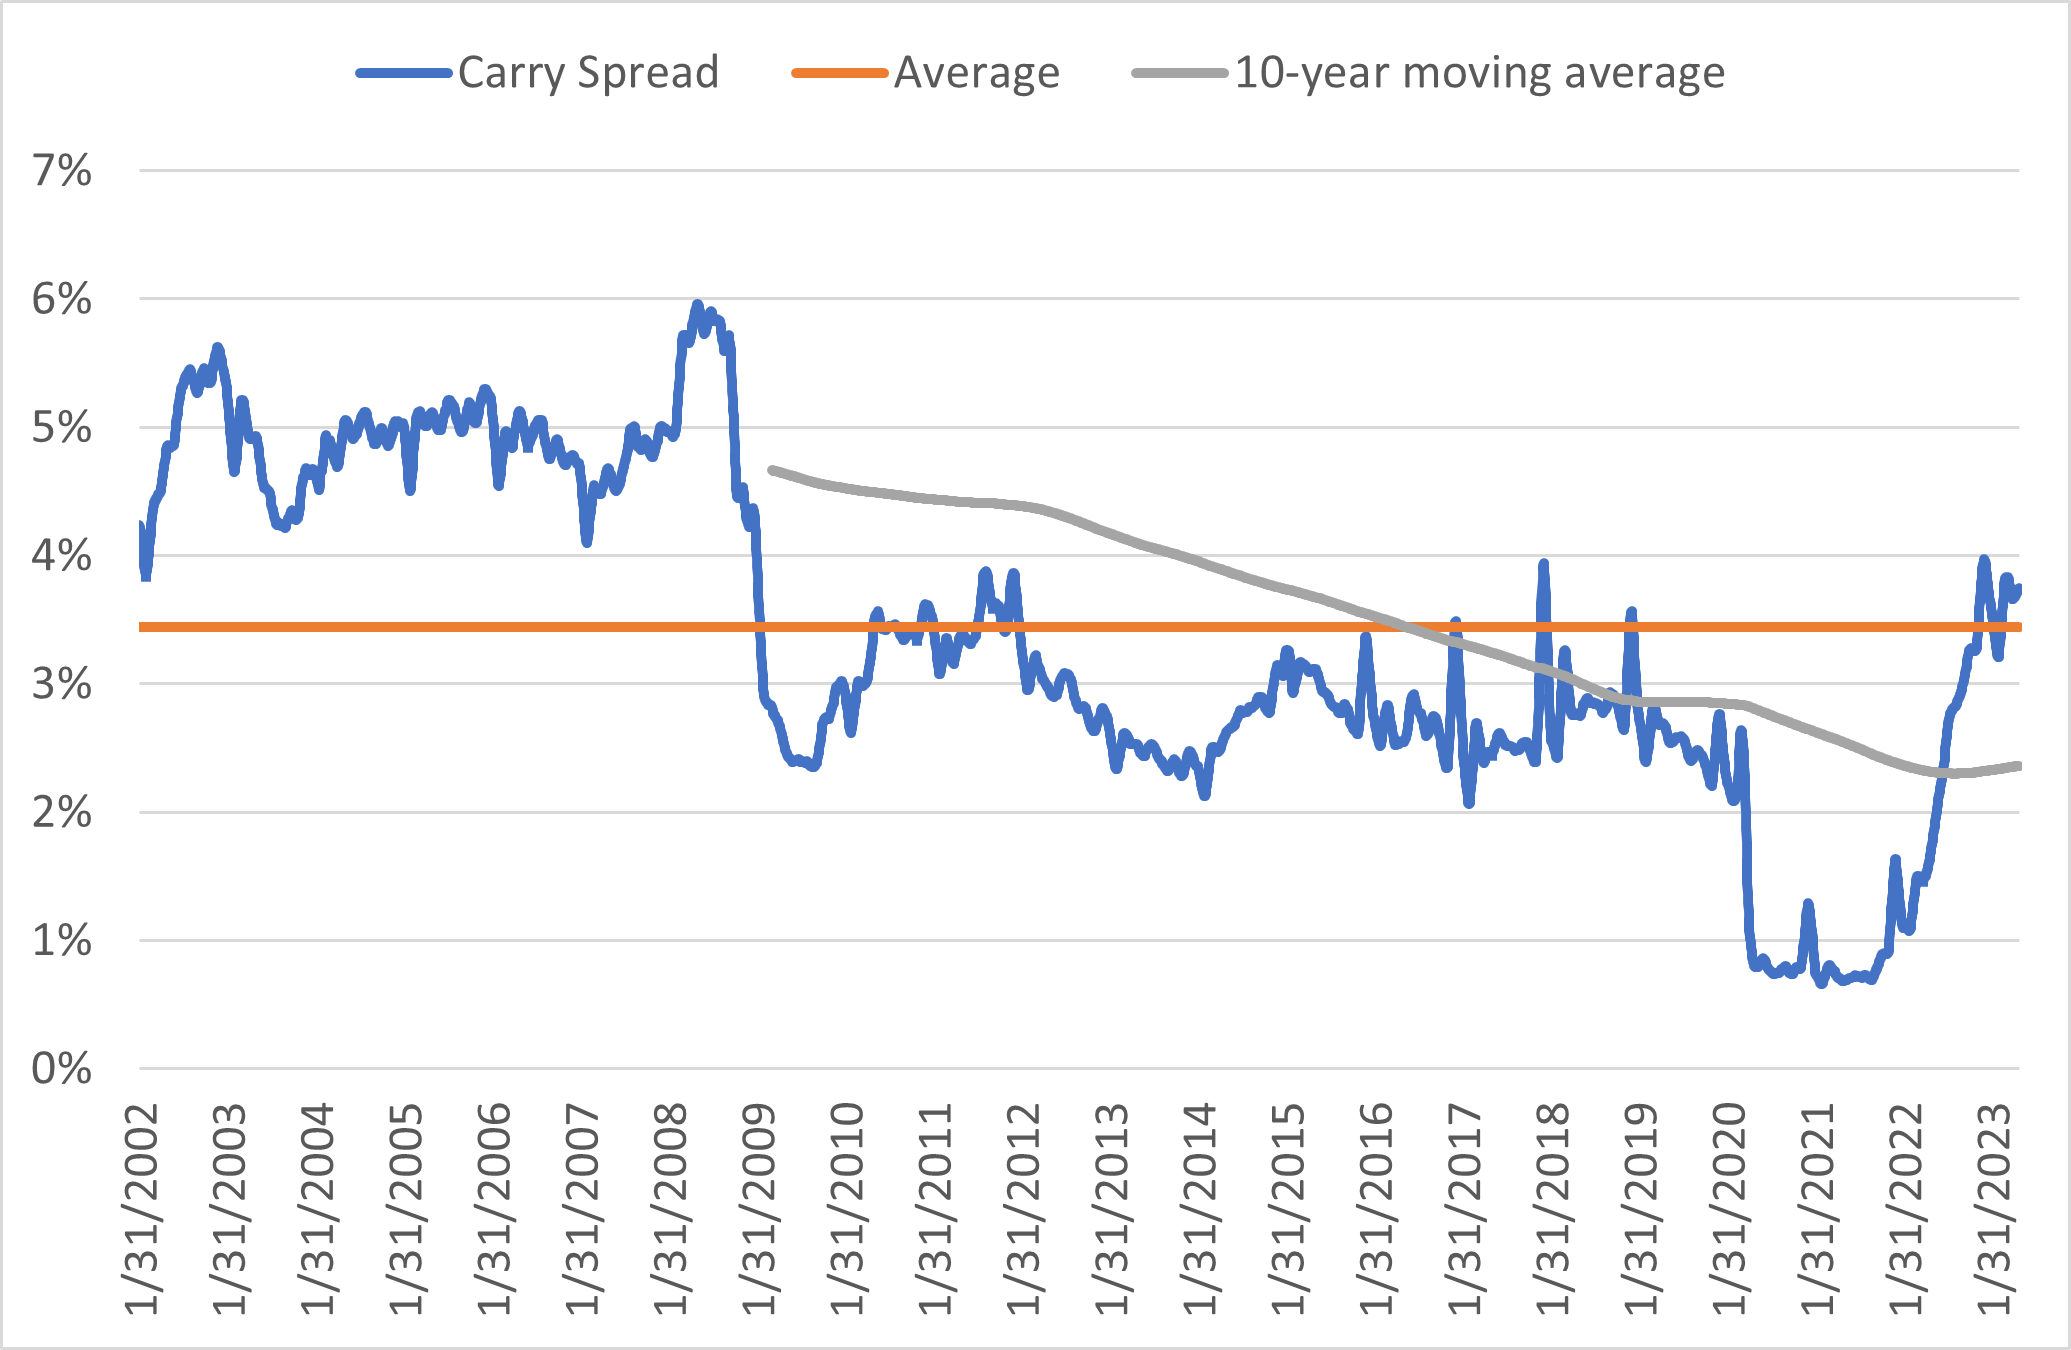
Source: Russell Investments, Bloomberg, as of 22 May 2023
Turning to the ARCS Value factor, we can construct a similar forward-looking indicator, which we call the Value spread. Valuation is measured as the distance between a currency's spot exchange rate from its purchasing power parity level (a notion of "equilibrium exchange rate") versus the U.S. dollar.1 The Value factor is long the cheap currencies whose exchange rate is below the equilibrium rate and short the expensive currencies at the other end of the spectrum. In analogy to the Carry spread, the Value spread is the difference in misvaluations between the long and the short Value currency baskets.
In Exhibit 4, we show the Value spread against its full-sample mean and 10-year average. As a metric of the Value factor's return prospects, the Value spread is at 38%, well above both averages (around 29%). The ARCS Value factor often experiences a drawdown when the Value spread widens (for example, 2020-2022). A falling Value spread is usually beneficial for the ARCS Value strategy (e.g., 2001-2006). From a relatively high starting point today, a fall in the Value spread becomes more likely. The spread had been significantly higher only during the early 2000s.
Exhibit 4: Value spread and averages

Source: Russell Investments, Bloomberg, as of 22 May 2023
The bottom line
We have shown how our Absolute Return Currency Strategy acted as a diversifier for stocks and bonds during a tough 2022. Indicators of future returns of ARCS appear promising, too.
Investors can use the disciplined systematic process of currency factor investing to capture the rewarded factors in foreign exchange markets. In our view, three factors that have lasted the test of time in currency markets are carry, value and trend. With ongoing challenging conditions from recession risk, political unrest and interest rate concerns, investors need to seek new sources of return and diversification. Currency strategies like ARCS can be used to potentially help improve risk profile and growth.
1 The U.S. dollar is chosen as the reference currency for all three strategies, but the positions and returns are independent to the choice of the reference currency.