Quarterly Trading Report – Q3 2023: A cruel summer for trading volumes?
Executive summary:
- During July and August, we observed higher-than-normal volatility in trading volumes across equities, fixed income, foreign exchange and derivatives.
- Credit volumes witnessed some strong highs and lows in the third quarter. Notably, July—a month where trading volumes are generally steady—saw very inconsistent flows over the month. September, meanwhile, followed historical trends with an increase in primary market supply, reflecting higher volumes in the secondary.
- In foreign exchange markets, August was the least favourable month for trading conditions during the third quarter. Volatility rose by 2.6% while top-of-book spreads widened by 1.6%.
The peak summer months during the Northern Hemisphere, July and August are normally calm for trading volumes across major asset classes, but 2023 bucked the trend.
Among the four major asset classes we trade—equity, fixed income, foreign exchange and derivatives—we observed higher-than-usual volatility in trading volumes during July and August. Instead of a normal steady flow, daily trading volumes in the summer months often varied more than usual, fluctuating wildly from one day to the next.
At Russell Investments, we were well-prepared for this unusual summer experience due to our 35-plus years of experience executing trades for a broad swath of institutional clients. We trade approximately $2.2 trillion on an annual basis through our multi-institutional platform and maintain a 24-hour global trading desk with access to over 100 countries globally across all asset classes. Drawing on this knowledge, here are our key takeaways from the third quarter of 2023 from the four largest asset classes we trade.
Equities
Global equity trading volumes surprisingly declined in the third quarter—a time where activity is traditionally muted due to the summer vacation calendar in the Northern Hemisphere. In Europe, trading volumes were down 20% year-to-date versus the same period in 2022, while the Americas and Asia-Pacific regions saw declines of roughly 10-15%. Some of this can be attributed to increasing interest rates and lack of conviction in the equity markets.
After spiking to start the year, volatility settled into lower levels by the end of the third quarter, bringing overall trading costs down, which is common in periods of lower trading volumes.
Fixed income
In fixed income, speculation on interest rates and their economic impact continued during the third quarter, while volumes in both credit and Treasuries drove markets during the low summer months.
The Treasury bear steepener—where yields on long-term U.S. government bonds rise at a faster pace than yields on short-term bonds—was likely driven by several factors, including U.S. Federal Reserve (Fed) interest-rate hiking, Treasury supply, and oil pricing concerns. Together, these factors illustrated technical weakness in the market.
Most of the recent moves were driven by real rates, with the 5-year and 5-year forward inflation expectation rate (5y/5y) trading around 2.27%—the highest since 2007. While real rates traded in the 2.5-3% range before the much-publicised 2013 taper tantrum, the current selloff creates risks for economic growth. We continue to monitor the Treasury supply, with 10-year equivalent Treasury issuance set to climb to a record high in fiscal year 2024 as more debt returns to private hands. The outlook for Treasury demand remains equally worrying amid the supply increase in both bills and notes.
Credit volume saw some strong highs and lows in the third quarter, with August traditionally being the lowest month next to December. Notably, July—a month where trading volumes are generally steady—saw very inconsistent flows over the month. September, meanwhile, followed historical trends with an increase in primary market supply reflecting higher volumes in the secondary.
Credit spreads floated around without direction in July and August due to low volumes but have sold off in recent weeks following the shift to a risk-off tone in equity markets. The sell off in equities has primarily been due to economic concern following unprecedented rate increases over the last year and a half. Financials and regional banks continue to lead wider spread changes for the sector but remain within year-to-date ranges.
Chart 1: Chart of daily difference between average volume and observed volume
(Click image to enlarge)
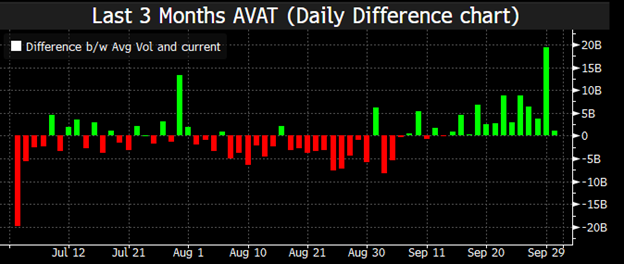
Source: BBG, Trace
Foreign Exchange
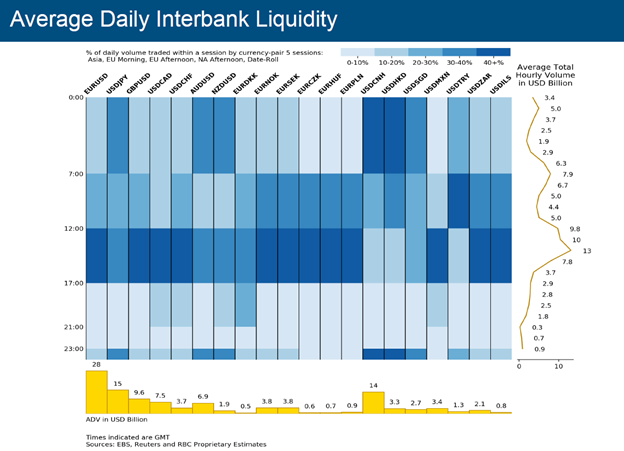
Reflecting the third quarter’s increase in volatility, overall average daily interbank traded volumes ticked up moderately, while top-of-book spreads and depth held reasonably stable. Interbank market average daily volume (ADV) and volatility rose by 3% and 4.7%, respectively. Meanwhile, top-of-book spreads widened by 0.2% and book depth dropped by 0.1%.
G-10 (Group of 10) spot FX experienced a smaller increase than the overall market (+1%), along with volatility (+1.9%). Trading conditions in G10 spot improved as top-of-book spreads narrowed by 0.8%, and book depth increased by 5.1%. While emerging markets spot ADV increased by +7.5%, trading conditions deteriorated, with top-of-book spreads widening by 4.3% and book volumes dropping by 12.3%. This can be attributed to heightened volatility over the period (+12.4%).
Diving deeper into the quarterly data, August was the month where trading conditions were the least favourable. Volatility rose by 2.6% while top-of-book spreads widened by 1.6%, although book depth increased by 1.5%. Factoring in the drop in average daily traded volumes (-6.9% month-over-month), it appears that these changes were likely due to the underlying seasonal effects of the Northern Hemisphere summer season, rather than a decline in the overall macroeconomic backdrop.
Chart 2: Average daily interbank liquidity
(Click image to enlarge)
Derivatives trading
While stocks and bonds may have witnessed lackluster volumes in the third quarter, one topic capturing attention was the highest-ever third-quarter volume in the Chicago Mercantile Exchange’s interest rate products.1 A lot of the chatter surrounded a particular use case (but by no means the only one). Relative value trading involves leverage positioning (vs. cash bonds). Headlines have raised questions about the liquidity of the U.S. Treasury cash bond market, the strength of clearing houses (this has attracted regulatory scrutiny) and the procyclicality of margin.
Initial margin is a percentage of the notional amount of the contract required as collateral. It is typically increased during times of significant volatility due to the margin models employed by clearing houses. The third quarter is arguably the worst time to request more margin from customers, and that helped create a vicious cycle. In late September, the Bank of International Settlements (BIS) even commented on the trend.2 Ultimately, however, the fact remains that there are several reasons investors favour the leverage and liquidity that futures offer.
The bottom line
In this industry, we know all too well that past performance is no guarantee of future results, and the recent volatility in trading volumes during what’s typically one of the quieter times of the year illustrates this well. Ultimately, it’s yet another reminder that, at the end of the day, markets are still unpredictable.
Trading volume and volatility are very unpredictable in our current environment, and this makes it all the more vital for investors to manage risk and be able to move money expeditiously. Russell Investments combats low volume with significant market depth through 400+ dealers to assist our clients with improved performance and minimal impact.
At Russell Investments, we’re committed to delivering scalable solutions that meet the trading and execution needs of asset owners and asset managers alike. We’re also dedicated to sharing our insights and observations from our global trading desk with you every quarter. Please reach out if you have any questions.
Download complete report