Mega cap tech dominance: It’s not just the U.S.
The phrase mega cap tech is often strongly associated with the U.S. equity market, to the point that household heavyweight names such as Apple, Amazon, Facebook, Google and Microsoft are typically the first words that spring to mind when the phrase is mentioned. And it’s no surprise why: after all, it’s widely known among investors and asset owners alike that the key determinant for beating the market in 2020 was the allocation to the top names in the S&P 500 ® Index in their U.S. equity portfolios, given their stellar outperformance last year.
Lesser known to many investors, perhaps, is that very similar dynamics have also taken place recently in the emerging markets (EM) asset class. 2020 exacerbated this trend of mega-cap tech dominance, with tech names in emerging markets benefiting from widespread stay-at-home measures as the COVID-19 pandemic erupted. Similar to the U.S., a narrow list of names has produced monstrous returns well ahead of the rest of the market in both the coronavirus-led market selloff as well as in the rebound that followed. For those less familiar with this asset class, the top five emerging-market index names are:
- Alibaba (digital platform including retail, social media and financial services)
- TSMC (global leading electronic chip manufacturer)
- Tencent (online gaming, social media platform)
- Samsung (electronics)
- Meituan (food delivery app)
While the individual stock names are of course different, the trend bears more similarities than differences. In other words, mega cap tech is not just a U.S. thing. Before we look into the 2020 experience and the role mega cap tech has played, let’s revisit the composition of emerging markets in order to illustrate some high-level comparisons with the U.S. market.
Emerging markets have moved well beyond being a play on commodities
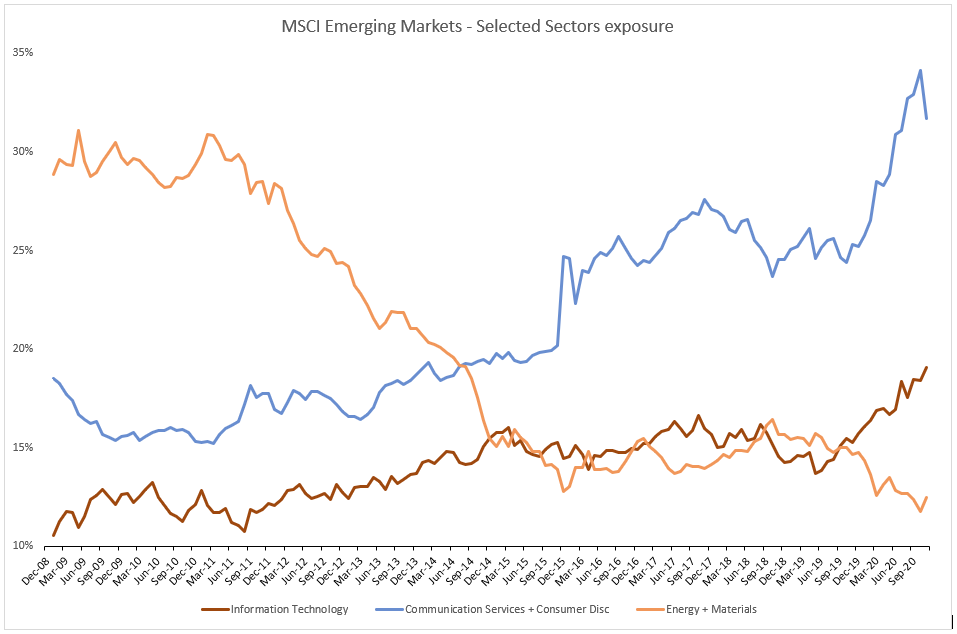
Many asset owners still associate an EM allocation as a play on commodities—in other words, the place to go to gain broader exposure to commodities such as oil or grains. This notion belongs well in the past, as the MSCI Emerging Markets Index’s weight of both digital consumption and internet-themed businesses—sectors of the so-called new economy—has ballooned over the past decade.
For instance, the consumer discretionary and communication services sectors (which capture a significant amount of internet-themed companies) have doubled in weight in the last 10 years, and now account for close to one-third of the total index. The increasing prevalence of e-commerce is also apparent, as reflected by the significant 13% index allocation to the internet and direct marketing retail industry within consumer discretionary sector. This all stands in stark contrast to what the EM opportunity set looked like only a decade ago, when the more traditional EM sectors of energy and materials accounted for close to 30% of the index. Notably, this weight has shrunk to less than half of that today.
Click image to enlarge
Source: Factset, MSCI, as of Nov. 30, 2020
Suffice it to say, the dramatic change in the sector composition of the MSCI EM Index is a true reflection of the evolution of the underlying markets. Domestic consumption growth has been a key structural theme investors are finding attractive by allocating to and investing in EM, in part due to favourable demographics and population growth, urbanisation and rising incomes. One contributing development to this is the successful penetration of accessible smart phone usage across all parts of EM, providing EM consumers with internet access. This has enabled the region to leapfrog the typical gradual evolution in consumer behaviour, shifting from limited local choices to a virtually unlimited platforms of goods and services at a rapid pace.
EM is starting to look a lot like the U.S. market
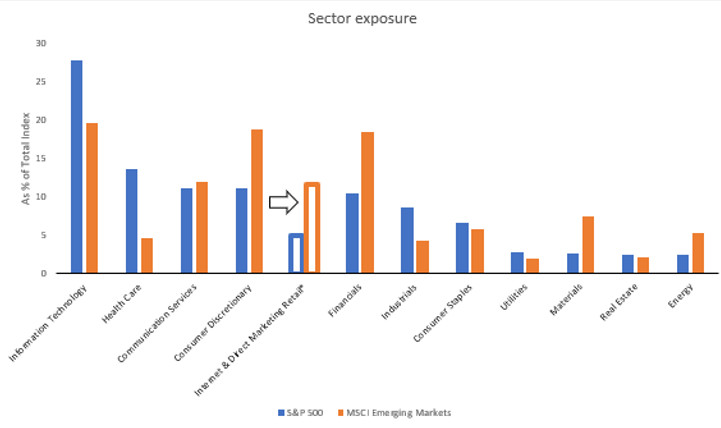
The sector composition of the MSCI EM index is reminiscent of the S&P 500: Consumers, communication services and technology sectors feature heavily in both indices. Some differences do remain, however, with the most obvious one being healthcare and financials. Here, EM still has a rather large allocation to financials (also seen as a proxy for consumer play), while the U.S. has a more prominent healthcare sector. Despite these differences, overall, the EM index is increasingly starting to look similar to the key U.S. equity-benchmark index.
Click image to enlarge
Source: MSCI, S&P, Factset, Nov. 30, 2020
Most in the investment industry are very familiar with the businesses of Amazon, Google and Facebook—as discussed above, they have been somewhat crowded trades among investors in the U.S. market. The changes in global consumer behaviour over the past decade have been well captured by these companies, allowing them to produce strong year-over-year growth rates. Notably, this trend is just as valid in emerging markets as in developed markets—and we believe it most likely has further room to grow.
As seen in the chart above, the internet and direct marketing retail segment within the consumer discretionary sector in the EM index now accounts for 13% of the entire EM opportunity set. This is more than double the weight of equivalents in the S&P 500. Online consumption has become a big part of the play on the EM consumer, and we believe this is a structural shift that is here to stay. Put another way, the COVID-19-induced rise in e-commerce and social media is unlikely to be a temporary trend, but rather a lasting movement that helps permanently reshape consumer behaviour.
It’s not just in the U.S. that these sectors are dominated by a handful of mega cap names. The EM index has a very similar concentration in companies, as illustrated by the table below. Although these businesses belong to three different sectors, the lines between the sectors are blurred. Ultimately, the five EM names listed here are all tech-like companies. (Could add YTD returns on all these names too)
|
|
|
|
|
|
Apple Inc |
Information Technology |
6.50% |
70.03% |
|
Microsoft Corp |
Information Technology |
5.30% |
37.32% |
|
Amazon.com Inc |
Consumer Discretionary |
4.39% |
70.90% |
|
Alphabet (A-Share Class) |
Communication Services |
3.53% |
35.66% |
|
|
Communication Services |
2.24% |
39.14% |
|
Total Top 5 |
|
21.96% |
|
|
S&P 500 index |
|
|
16.27% |
|
|
|
|
|
|
Alibaba |
Consumer Discretionary |
6.55% |
24.47% |
|
TSMC |
Information Technology |
5.87% |
61.59% |
|
Tencent |
Communication Services |
5.67% |
55.12% |
|
Samsung |
Information Technology |
4.88% |
41.16% |
|
Meituan |
Consumer Discretionary |
1.72% |
174.39% |
|
Total Top 5 |
|
24.69% |
|
|
MSCI Emerging Markets Index |
|
|
14.64% |
Source: Factset, Dec. 7, 2020
These names all produced incredible returns in 2020, and contributed to a disproportionate amount of index return. The price investors are willing to pay for the future growth of these companies are at an all-time high.
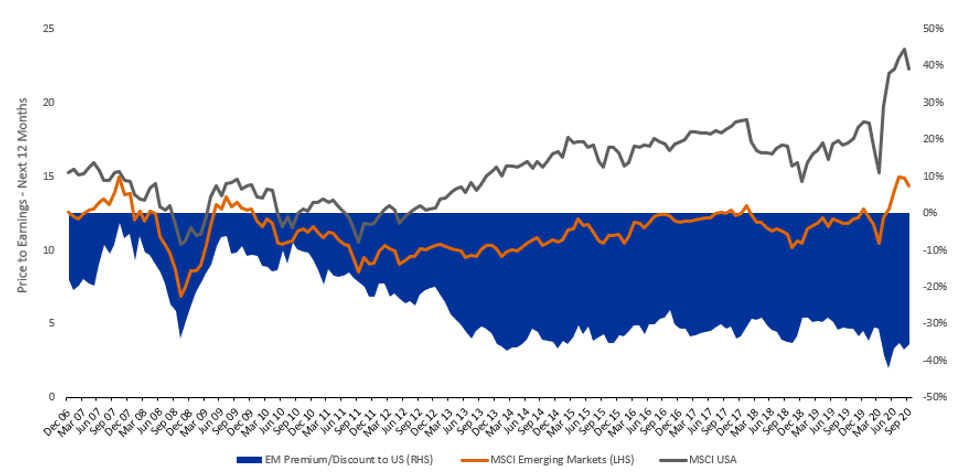
The many similarities of the two indices brings into question the valuation dispersion between the two markets, as seen from chart below comparing the forward price-to-earnings ratios of the MSCI EM and the MSCI USA Index. Is it still sustainable/justifiable for EM to trade at such a wide discount compared to the U.S. equity market? As we’ve demonstrated above, EM has moved a long way from being just a cheap production hub and commodity exporter for developed economies, which has formed part of the valuation argument before.
Click image to enlarge
Source: MSCI, Factset, Sept. 30, 2020
Narrowness of markets and challenge for active
The concentration of both the S&P 500 Index and the MSCI EM Index are at unprecedented high levels, as measured in the chart below, which looks at the Herfindahl-Hirschman Index of both indices—a common measure of concentration.
Click image to enlarge
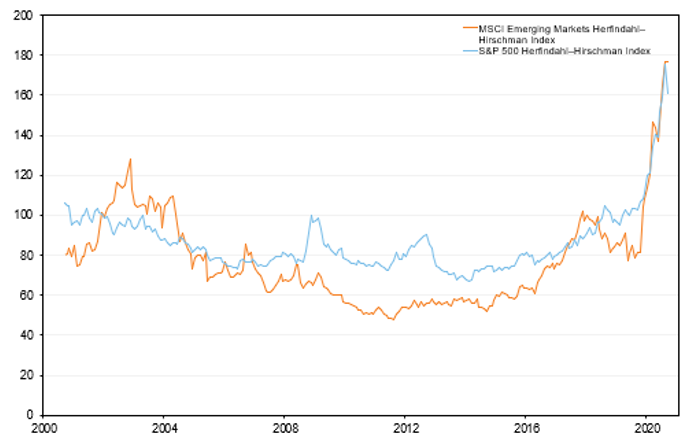
The extreme and extraordinary acceleration in index concentration experienced in 2020 was led by mega cap tech names at elevated valuation levels—and we believe it’s unlikely to be sustainable. While plenty of active managers have become painfully aware of how costly it can be to take a bet against the narrow drivers of the index return, it’s important to note that we are expecting a broadening out of markets in 2021. This, in our opinion, should bode well for active managers. Remember, the EM opportunity set spans 27 countries and offers the ability to truly be exposed to a diverse list of differentiated alpha sources beyond the mega cap tech names in a few countries. We believe this offers similar, if not higher, future growth potential at lower valuations.
It’s also worth noting that in recent months regulators across the globe—including within EM, and in China specifically—have been ramping up scrutiny on mega cap tech companies. In particular, the dynamics of some of the platform providers have sparked discussions of potential violations of anti-trust laws and anti-competitiveness measures. We believe these companies are already priced to perfection, relative to the rest of the market, so any legal risk to these companies and their future growth and profitability may be reason enough to move away from the crowded trades.
The bottom line
Buoyed by rising domestic consumer and tech advancements, EM has become much more than a play on commodities. This change calls into question the sustainability of the historic discounted valuation levels to developed markets, which has partly been justified by the historical dominance of deep cyclicals. Regardless, we believe that EM is still likely to trade at a discount to the developed world, primarily due to the other macro and political risks it exhibits as an asset class.
It’s true that today, mega cap tech in both the U.S. and EM is trading at elevated valuation levels. However, a comparison among the top five names in each index as well as sector valuations shows that the EM names are still trading well below their U.S. counterparts and may have further to go, potentially benefiting from significant tailwinds in markets like China.
Ultimately, we believe that EM has scope to continue to recover, narrowing the widened gap in valuation relative to developed markets—in particular, to the U.S. equity market. In our opinion, the asset class is likely to continue benefiting from the encouraging global dynamics currently in play, including the much-anticipated roll out of COVID-19 vaccines, the reopening of more economies, continued government stimulus and a weakening U.S. dollar (which should be supportive for EM).
While we believe the tech theme is a structural growth theme in EM that’s here to stay, we also think that investors are unlikely to stay crowded in the current narrow list of names dominating the MSCI Emerging Markets Index. While the top-heavy index has presented a significant headwind for many active investors in EM in the past 12 months, we believe it will become an opportunity for active management when the concentration abates and the market broadens out—signs which have become more apparent recently. On the passive side of the spectrum, we believe that caution is warranted when buying the concentration risk in the EM index and focusing on a narrow list of leading companies in increasingly overbought territory.