The Global Housing Inspection Report – 2023 edition
Executive summary:
- Aggressive monetary policy tightening in developed markets led to a drawdown in house prices in 2022, but not a meltdown
- Early 2023 showed some signs of encouragement in developed country housing markets, but we think it's too early to say that the bottom is in sight
The bottom line:
The residential housing market can be dynamic and nuanced, but we believe that working with a trusted advisor can help you be better positioned to handle uncertainty.
Introduction
"The Green Path? Or the Yellow Path?" Dora the Explorer would ask, standing in front of a cornfield labyrinth.
And thousands of children would yell out, "The Green Path," the path proposed by Dora's trusty map, the one that 99% of the time would be right.
Sadly, navigating the economy and markets is not nearly as simple. As the leading and lagging economic indicators continue their tug-of-war over whose vision of the economy will turn out to be correct, let's revisit an old friend of ours—the housing market – and try to divine which path it is on. In this 2023 edition of the Global Housing Inspection Report, we'll explore the state of the housing market in several key developed markets: the U.S., Canada, the UK, and Australia.
The below graphic shows our latest assessment of the housing market on five factors, and a comparison to our initial assessment in 2022. As a reminder, green represents areas of low risk or positive trends, yellow represents areas of intermediate risk or neutral trends, while red represents areas of high risk or negative trends.

Source: Russell Investments. 2022 June data are from Russell Investments' 2022 blog "The Global Housing Inspection Report," which was published in June 2022 and uses data through March and April 2022. The current data leverages data available as of March through May 2023.
Current price trends: A drawdown, not a meltdown
For those who read our 2022 report, the chart below will look familiar. It examines a popular home price index for each of the four markets under consideration.

Source: Russell Investments' calculation of year-over-year percentage changes in the values of the S&P CoreLogic Case-Shiller Home Price Index, CANSIM New Housing Price Index, UK England House Price Index, and Australia CoreLogic Home Property Value Index 5 City Aggregate. Index data sourced from Refinitiv Datastream.
The effect of central bank monetary policy tightening has taken a noticeable toll on developed country housing markets. Year-over-year home price growth rates have fallen significantly from their 2022 peak for each of the regions in our report. In Canada and the U.S., key home price indices are roughly flat year-over-year, while in Australia, the home price index has fallen by roughly 9% year-over-year.
While these price changes may appear to paint a bleak picture for the residential housing market, we should put the performance in context. Remember how in our 2022 report we said that we are not expecting a repeat of the damage done in the Global Financial Crisis (GFC)? At the GFC-era nadir for each of the housing markets, year-over-year home price percentage change was deeply negative. Today, only the home price index in Australia has turned deeply negative.
Some may argue that the current housing downturn in Australia is more substantial than that felt during the GFC. We would respectfully disagree. Although the home price drawdown reached 9% year-over-year in the current episode compared to the 8% year-over-year drawdown in the GFC era, the current drawdown comes after a more than 20% year-over-year price gain, whereas the pre-drawdown price gain in the GFC only reached a maximum of 14% year-over-year.
Thus, from our perspective, the housing markets experienced a drawdown, not a meltdown. We believe that real estate investors need not panic.
In the more recent months, promising signs of a potential rebound greeted investors. In Canada, the Canadian Real Estate Association (CREA) MLS Home Price Index saw four straight months of month-over-month percentage increases. Meanwhile, a similar trend occurred in Australia, with home prices increasing in March, April, and May 2023, according to CoreLogic.
However, we believe it may still be too early to officially call the bottom of the housing market. With interest rates continuing to remain at elevated levels, the residential housing market will likely face continued headwinds in the near-term. In fact, in places like Canada and Australia, the rebound in house prices was actually one of the catalysts for the central banks resuming rate hikes after an initial pause.
Sales transaction volumes: Lower prices may be encouraging activity
If you've ever driven a car down the steep incline of James Street in Seattle, you would know how easy it is to get to 20-30 miles per hour with only minimal pressure on the accelerator. The slope of the road causes the car to pick up forward momentum, even as it may be losing altitude. In a similar vein, after a period of declining home prices, more buyers may be encouraged to come off the sidelines, helping to reinvigorate sales transaction volumes.
In the U.S., year-over-year growth in new home sales returned to positive territory in April 2023, coming in at a robust 12% year-over-year pace. Existing home sales, while still in noticeably negative territory on a year-over-year basis, have bounced more than 6% of this cycle's lows. Although existing home sales might still have a lengthy runway before returning to positive year-over-year growth, the recent developments do suggest that the lower prices might be tempting to some buyers.
Similarly, CREA reported that Canadian home sales volumes returned to positive year-over-year growth in May 2023 on an unadjusted basis, after two years of declines. On a seasonally adjusted basis, home sales saw positive monthly growth for four consecutive months.
Falling prices weren't sufficient to boost sales transaction volume in all regions though. In the UK, data from HM Revenue and Customs noted that they "now see a return [in April 2023] to the downward trend in non-seasonally adjusted transaction levels across both the residential and non-residential sector relative to March. Seasonally adjusted figures have also returned to their downward trend."
In Australia, CoreLogic points out that despite some progress, housing transaction volumes were still below the five-year average in May 2023.
Overall, the sales transaction volume aspect of the housing market presents a mixed bag.
Affordability: A perennial challenge for Canadian and Australian homeowners
One of my high school teachers used to joke that people in my generation (Gen Z) would never be able to afford a home in Toronto, and would therefore have to live in Barrie. That is roughly a 2-hour one-way commute from downtown Toronto!
While painful, his joke has an element of truth to it. Home prices in large urban cities such as Toronto and Vancouver still remain out of touch for many Canadians, even though house prices have fallen from their peak. The picture is less bleak in the suburbs and rural parts of Canada, but with an overall home price-to-after-tax income ratio of more than 14, affordability can be a noticeable challenge.i
The ratio in Australia is also stretched, with a home price to after-tax income ratio of more than 12 times.ii
In addition to looking at the price-to-income ratios, we also have to remember that interest costs play a key role in determining home affordability. Gone are the days of financing a home for 3% interest. With central banks in all four regions aggressively hiking interest rates, new homeowners will feel the sting as they try to obtain financing for their purchase. And in countries with a high proportion of homeowners who have variable rate mortgages, even existing homeowners won't be spared.
Finally, household debt to disposable income ratios continues to remain elevated in both Canada and Australia, putting further pressure on the housing markets in these regions.

Source: Refinitiv Datastream, data through Q4 2022.
Population: Immigration can make an impact
Over a medium to longer-term horizon, population growth can play a key role in determining the strength of the housing market. After all, people need a place to live.
In the U.S., some politicians favor reforming immigration laws to bring in more people, but others prefer tightening entry requirements for immigrants. Ultimately, the divided control of the U.S. Congress means that the nation is unlikely to see strong changes to its immigration policy in either direction.
In contrast, the government in Canada has been actively encouraging new immigrants to call Canada home. This has led to Canada recently surpassing the 40 million people threshold, a milestone that the U.S. Census Bureau's projections did not expect Canada to reach until 2028.
Australia continues to set an ambitious target for new immigrants, although the 2023-2024 cap is slightly lower than the 2022-2023 cap.
Finally, the UK migration trends are somewhat bleak, with the Office of National Statistics estimating that the annual net migration amount would fall through 2027, before stabilizing thereafter.
Click image to enlarge

Source: UK Office of National Statistics, Revised January 2022
While there's always an inherent element of uncertainty associated with forecasting, the data suggests that the housing market in the UK may be more vulnerable to population-related headwinds than the other developed market regions being analyzed in our report.
Supply constraints can put a floor under U.S. home prices
The prices for residential housing are ultimately driven by both demand and supply. Having already examined the demand piece by looking at population trends, it's worthwhile to look at the supply aspect. In our 2022 report, we noted that the housing supply in the U.S. was very tight. The latest available data shows a continuation of that theme—with the U.S. existing home listings to population ratio (a metric of housing supply) remaining at historically low levels.

Source: Refinitiv Datastream, data through Q4 2022.
The ratio of new home sales to population has been trending upward, but we do not anticipate that this would meaningfully alter the supply shortage. New home sales are a much smaller element of U.S. housing supply compared to existing home sales. Furthermore, the run-up in the new home sales to population ratio may have been driven by builders finally being able to clear some of their backlogs as supply chains heal and labor markets slowly become more balanced.
Over time, as the fangs of the macroeconomic headwinds continue to sink into the U.S. economy, we would expect that homebuilders would be more measured in new construction. Higher interest rates not only affect the ability of homeowners to obtain mortgage financing but also impact the ability of builders to finance their new home construction projects.
As such, the overall supply shortage of residential housing in the U.S. may persist for some time and limit the extent to which home prices in the U.S. can fall.
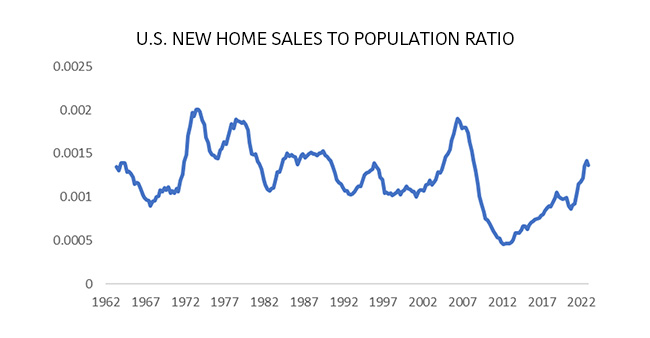
Source: Refinitiv Datastream, data through Q4 2022.
When we look at the picture in non-U.S. markets, we see that supply constraints are not as pronounced. The Australian dwelling approvals to population supply metric appears to be near its lows, but we don't see the clear strong downtrend that we saw in the U.S. existing home listings to population ratio.

Source: Refinitiv Datastream, data through Q1 2023.
In Canada, the housing starts to population metric isn't too far away from its longer-term median.
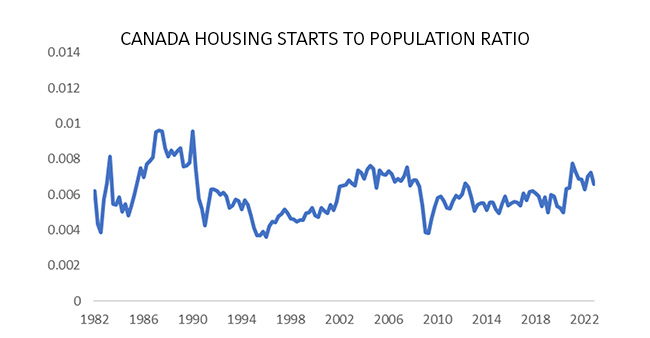
Source: Refinitiv Datastream, data through Q4 2022.
And in the UK, the housing starts to population metric has retreated once again after coming close to historic highs.
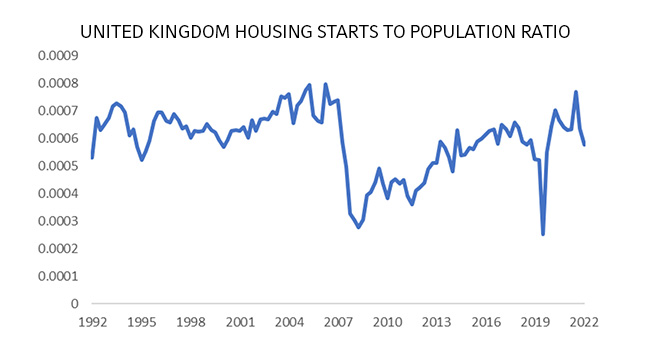
Source: Refinitiv Datastream, data through Q4 2022.
How institutional investors can position themselves amid the complex housing market environment
When we were children, we started by learning about the primary colors: red, yellow and blue. As we got a bit older, we learned that we could mix primary colors together to achieve secondary colors. But as we grew into adults, we realize that colors are nebulously defined. There are many different combinations of RGB values that could result in various shades of orange.
In a similar vein, the near-term outlook for the residential housing market may also not be clearly defined. While we've seen promising early signs of stabilization in some metrics and some regions, the considerable amount of monetary policy tightening may continue to create challenges for the housing market. And recession risks, in our opinion, continue to loom large.
But as we look beyond the potential recession and to the potential recovery, we think that investments in residential real estate can be an important diversifying asset in your portfolio. Ultimately, we believe that by staying disciplined and working with a trusted advisor, investors can be better positioned to navigate the uncertain environment.
i CREA lists an average home price of $729,000 CAD in May 2023. The latest available (March 2023) weekly earnings data from Statistics Canada shows typical weekly earnings of $1,185.03 CAD per week, equivalent to $61,622 CAD per year. The PwC Worldwide Tax Summaries for Canada shows that a taxpayer earning this amount would pay $9,698 CAD in Federal Taxes, resulting in an after-tax income of $51,924 CAD. This works out to a price-to-after-tax income ratio of 14.09x. For simplicity, we have not included the effects of provincial/territorial tax, nor the effect of tax credits, the eligibility for which may vary from taxpayer to taxpayer.
ii The CoreLogic Home Value Index for Australia shows a median home value of $715,092 AUD as of May 2023. The latest available (Nov 2022) average weekly earnings data from the Australian Bureau of Statistics shows typical weekly earnings of $1,378.60 (an "all employee" blend of full and part time). This works out to $71,687 AUD per year. The PwC Worldwide Tax Summaries for Australia shows that that a taxpayer earning this amount would pay $13,765 AUD in Federal Taxes, resulting in an after-tax income of $57,922 AUD. This works out to a price-to-after-tax income ratio of 12.3x. For simplicity, we have not included the effects of tax credits, the eligibility for which may vary from taxpayer to taxpayer.