Five key ways advisors deliver value in 2019
We believe advisors have never been more valuable.
For the past five years, we’ve created an annual report that holistically analyzes the real value advisors deliver to their investor clients in their portfolios, in vital services advisors provide, and this year, especially in their after-tax returns.
It’s hard to avoid the growing regulatory attention on advisory fees and natural consumer skepticism about delivered value. So today’s advisors may be challenged to articulate the material value they deliver. That’s why it’s so important to provide a simple, easy-to-follow equation that shows the full value of an advisor’s services. It’s as easy as ABC, and then some:
Value of an Advisor = A+B+C+P+T

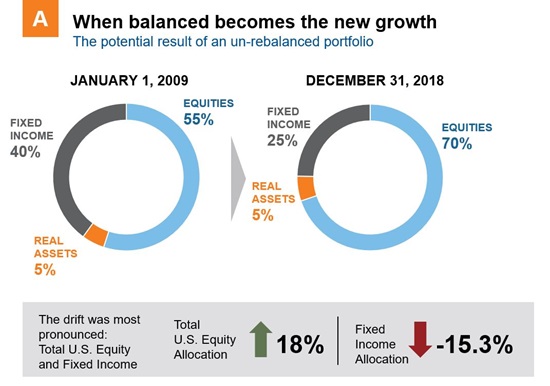
A is for Annual rebalancing
When markets are rising, it can be easy to underestimate the importance of disciplined rebalancing. We believe rebalancing is vital, because it is designed to help investors avoid unnecessary risk exposure. Imagine you have a hypothetical balanced index portfolio that has not been rebalanced. In certain market conditions, it could end up looking more like a growth portfolio and expose the investor to risk they didn’t agree to. The annual rebalancing an advisor provides can help keep that from happening.
We believe there are two reasons that many end investors don’t rebalance if left to their own devices:
- Because it’s an easy thing to forget to do. Investors know they’re supposed to do it. We also know we’re supposed to change the batteries on our smoke alarms once a year. But do we really do it?
Because, in many cases, rebalancing may be the equivalent of buying more of what’s been hurting my portfolio and selling what’s been doing well. It may run counter to what an investor’s gut feelings are telling them they need. Rebalancing takes discipline. Advisors can help deliver that discipline and help position investors for long-term success.
Source: Hypothetical analysis provided in the chart & table above for illustrative purposes only. Index returns represent past performance, are not a guarantee of future performance, and are not indicative of any specific investment. only and based on past performance, and not a guarantee of future performance. Source for both chart & table: U.S. Large Cap Growth: Russell 1000 Growth; U.S. Large Cap Value: Russell 1000 Value; U.S. Small Cap: Russell 2000; International Developed: MSCI World ex USA; Emerging Markets Equity: MSCI EM; Global Real Estate: FTSE EPRA NAREIT Developed: Fixed Income: Bloomberg U.S. Aggregate Bond.
B is for Behavioral mistakes
Behavior coaching is one of the most vital parts of the trusted advisor job description. It’s inherent in the idea of advising. And when it comes to delivering value, avoiding behavioral mistakes is a significant contributor to total value—perhaps even the most significant.
Left to their own devices, many investors buy high and sell low. From December 2007 to December 2018, investors withdrew more money from U.S. stock mutual funds than they put in. All the while, $100 constantly invested in the Russell 3000® Index more than doubled in value. And those who chose to stay in cash during that period missed a cumulative return of more than 114%, based on the Russell 3000® Index. Helping your clients avoid pulling out of markets at the wrong time and sticking to their long-term plan is one way advisors provide substantial value.
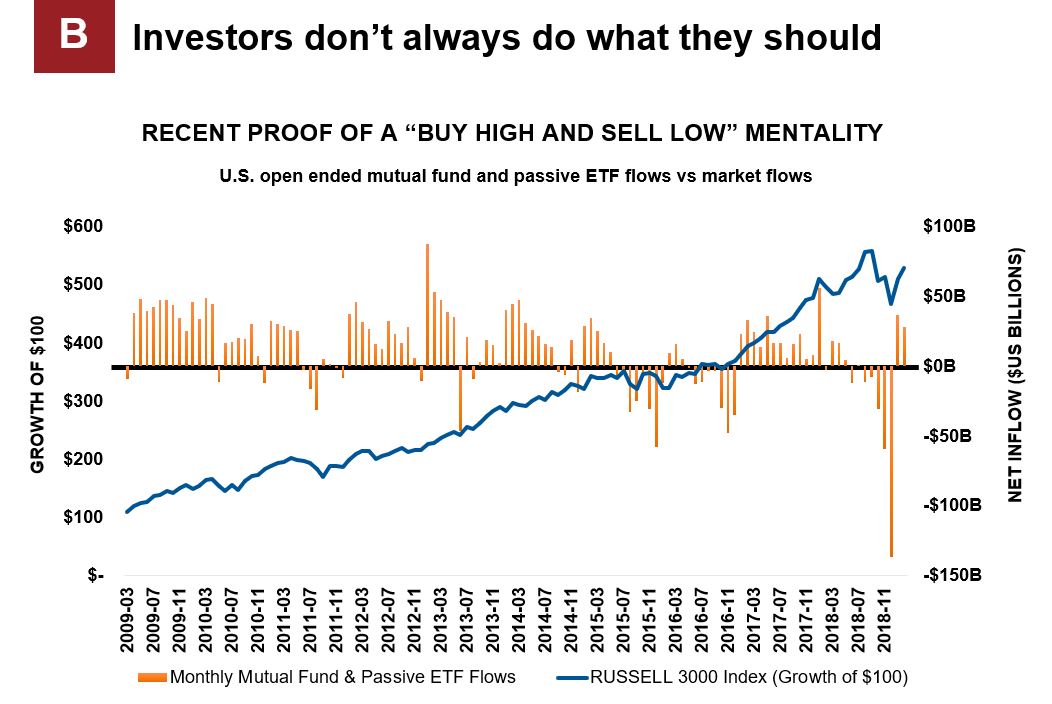
Data shown is historical and not an indicator of future results. Sources: Monthly mutual fund, passive ETF flows and Russell 3000® Index, Morningstar, Direct. Data as of February 28th, 2019. Index performance is not indicative of the performance of any specific investment. Indexes are not managed and may not be invested in directly.
C is for Cost of investment-only management
What is a bare-minimum investment management worth? Let’s be brutally fair with these numbers: What would investment management cost if a robo-advisor did it? And what does a robo-advisor deliver?
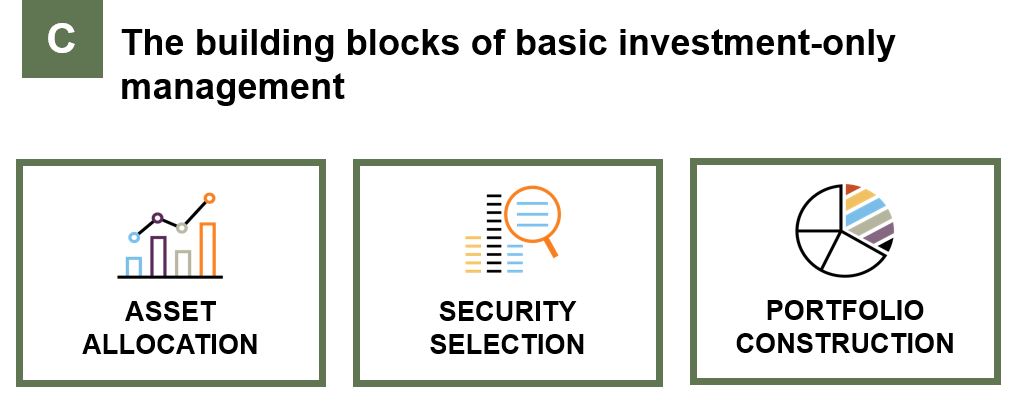
Most robo-advisors that deliver investment-only management and no financial plan, no ongoing service, and no guidance, still charge something, even if it’s just a small amount. Even if it’s just for annual statements, online access, and a phone number to call in case of questions. Are you making sure your clients acknowledge that you provide the value of investment management as only one small part of your offering?
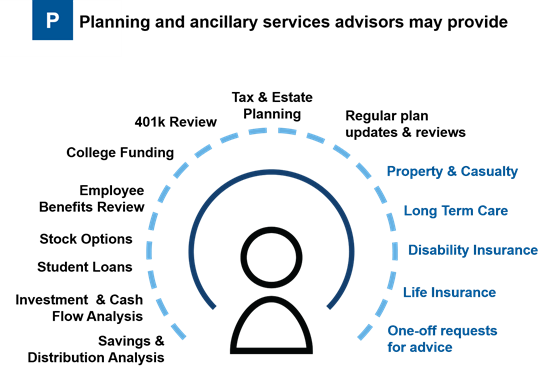
P is for Planning costs and ancillary services
Advisors advise. As obvious as this sounds, it’s worth stating that financial advisors add value by doing the hard work of shepherding a strategy from origination to outcome. That means plan reviews, analyzing savings and investments, looking at student loans and stock options, considering employee benefits, 401ks, and college funding and tax and estate planning.
What is the value of a comprehensive financial plan? Per a recent financial study* conducted by Michael Kitces (Source: The Kitces Report Volume 1, 2018 – kitces.com), the average standalone planning fee for a comprehensive plan was around $2,900. Are your investor clients aware of that value?
And what about the ancillary services you and your team offer? We believe advisors and their staff consistently underestimate the value of the ancillary services—insurance needs, custom requests and questions—they may provide their clients. These additional services can quickly consume 20, 50, or 100 hours each year. Make sure your clients consider what those professional hours are worth.
T is for tax-smart investing
We’ve written a lot about tax-smart investing. Why? Because we see the remarkable value it may provide. Because when it comes to investing, it’s not what you make. It’s what you get to keep. We believe wise advisors don’t just focus on returns. They focus on after-tax returns. Providing a more tax-smart approach can have substantial impact on the size of those after-tax returns. While downward fee pressure can mean downward value trends in other areas, advisors who focus on tax-smart investing can distinguish themselves and demonstrate differentiating value.
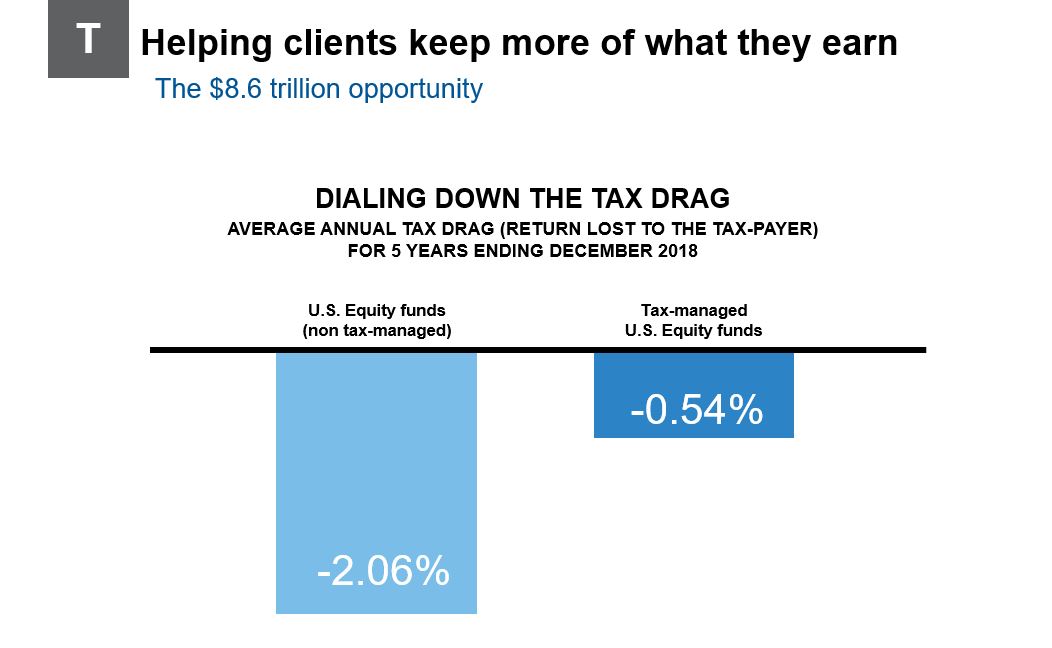
Just how much return can be added with a tax-smart approach? The average annual tax drag for the five years ending December 31, 2018 was significant. Investors in non-tax managed U.S. equity products (active, passive, and ETFs) lost on average 2.06% of their return to taxes. Those in tax-managed U.S. equity funds forfeited only 0.54%. With taxable investors holding $8.6 trillion of the $15.7 trillion invested in open-end mutual funds, this is a massive concern—and a massive opportunity for added value.
Tax-smart advisors can help add this value by helping build and implement a personalized, comprehensive, and tax-sensitive investment.
Tax-managed: funds identified by Morningstar to be tax-managed.
Universe averages*: Created table of all U.S. equity mutual funds and ETF’s as reported by Morningstar. Calculated arithmetic average for pre-tax, post-tax return for all shares classes as listed by Morningstar.
Morningstar Categories included: U.S. ETF Large Blend, U.S. ETF Large Growth, U.S. ETF Large Value, U.S. ETF Mid-Cap Blend, U.S. ETF Mid-Cap Growth, U.S. ETF Mid-Cap Value, U.S. ETF Small Blend, U.S. ETF Small Growth, U.S. ETF Small Value, U.S. OE Large Blend, U.S. OE Large Growth, U.S. OE Large Value, U.S. OE Mid-Cap Blend, U.S. OE Mid-Cap Growth, U.S. OE Mid-Cap Value, U.S. OE Small Blend, U.S. OE Small Growth, U.S. OE Small Value.
*Methodology for Universe Construction on Tax Drag chart: Tax Drag represents the average Morningstar Tax Cost Ratio for funds in each category. The Morningstar Tax Cost Ratio measures how much a fund’s annualized return is reduced by the taxes investors pay on distributions
The bottom line
Advisors charge for their service. The focus on fees is a daily conversation in our industry. Your clients hear that conversation. Do they also hear about the value you provide? We believe advisor value far surpasses the typical amount charged in fees. Your clients should believe the same. Remember, your satisfied clients—those who believe in your value—are your most persuasive advocates. Helping them understand the value you deliver is key. This formula offers a memorable and repeatable framework for you to have that conversation with confidence.
To learn more about the 2019 Value of an Advisor Study, click here.