Thinking about market timing?
In recent weeks, how many times have you fielded the question, should I be moving to cash? Or maybe it's come in the form of a bold (panicked?) statement, I need to move to cash.
We have certainly seen an uptick in this sentiment accompanying the increase in market volatility this fall.
Skittish investors are eyeing the current CD rates and thinking, a 2% to 3% return looks pretty attractive relative to a market correction.
Are investors best served by abandoning their long-term allocations to move to the safety, but limited return potential, of cash? It's never been easy to correctly time markets--but is this time different?
Let's put emotions aside for a minute and look at some of the data. Historical perspective on how frequently portfolios have lost money may help investors wrestling with the notion of exiting the market.
Considerations before moving to cash
Before considering a move to cash, investors should assess a few factors:
- How frequently have markets turned negative--and how long has that lasted?
- How confident are you about the sell signal, and how will it feel if you're wrong?
It's true that capital markets have produced negative results for investors at times. The shorter the time horizon, the more frequently this occurs. Looking back over the last 50 years, diversified portfolios* have produced negative returns approximately one-third of the months. One in every three months is rather frequent. For those investors with an extremely short time-horizon, cash may be a viable option.
If you extend your time horizon out to one-year, diversified portfolios have delivered negative results approximately 15% of the time. That may still be too great a risk for investors with a short horizon. However, as the time horizon begins to lengthen, the negative numbers come down quickly as seen in the chart below.
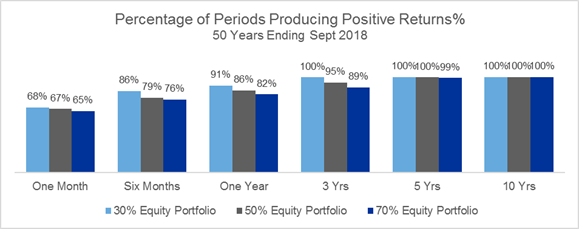
Note: Hypothetical analysis provided for illustrative purposes only. *Diversified Portfolios: Three Index Portfolios Comprised of S&P 500 Index (S&P500), MSCI EAFE Index (EAFE), and Bloomberg U.S. Aggregate Bond Index (AGG); 30% Equity: 20% S&P500/10% EAFE/70%AGG, 50% Equity: 34% S&P500/16% EAFE/50% AGG, 70% Equity: 47% S&P500/23% EAFE/30%AGG
At one year, a 50% equity portfolio has produced positive results 86% of the time and this jumps to 95% and 100% over three- and five-year horizons. Over the last 50 years the occurrences of negative investor returns stretching much beyond twelve months has been relatively small. To attempt to correctly, and consistently, time those narrow windows of negative results seems a difficult exercise.
To address the sure it's a narrow window, but this is a clear sell signal argument, let's review historical signals that were obvious sell warnings.
Market timing signal--Exhibit A: When Lehman Brothers declared bankruptcy in September 2008
In hindsight, that certainly seemed like a sell signal. Or was it?
For investors in a hypothetical 50% equity index portfolio as shown above who anticipated the Lehman bankruptcy and got out of the markets on August 31, 2008, their timing helped them avoid a -4.2% loss over the following 12 months (ending August 2009).
For investors who experienced the bankruptcy and decided to get out of the market on September 30, 2018, they missed out on a 4.4% gain over the following 12 months (ending September 2009). Yes, there was a significant equity market drawdown in the midst of this, but investors who stayed invested profited from the 2009 market rally.
So, in the case of the Lehman Brothers bankruptcy, there was a very narrow window of time during which investors benefited from selling out a hypothetical 50% equity index portfolio.
The next step for those investors who exited the market is: When would it feel good to get back in? That's a whole other can of worms--and emotions. Some investors have never gotten back in post 2008.
Market timing signal--Exhibit B: The inverted yield curve
A signal that occurs more frequently than the Great Financial Crisis is an inverted yield curve--when the yield of short-term Treasuries is above that of the 10-year U.S. Treasury Yield Curve.
This signal has sounded five times over the last 50 years and in each case a recession--typically accompanied by a significant equity correction--has followed. A challenge has been that these recessions have fallen anywhere from six months to 24 months after the curve initially inverts--and these periods often experience positive returns that should not be missed.
So the inverted yield curve may not be an immediate market signal despite its recession warning capability. In fact, actual historical results suggest that the inverted yield curve may not give much of a warning signal at all.
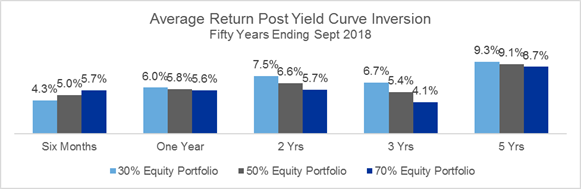
Note: Hypothetical analysis provided for illustrative purposes only. Diversified Portfolios: Three Index Portfolios Comprised of S&P 500 Index (S&P500), MSCI EAFE Index (EAFE), and Bloomberg U.S. Aggregate Bond Index (AGG); 30% Equity: 20% S&P500/10% EAFE/70%AGG, 50% Equity: 34% S&P500/16% EAFE/50% AGG, 70% Equity: 47% S&P500/23% EAFE/30%AGG.
On average, time periods following inversions have produced positive returns. Moving out beyond one year shows a pattern of lower risk (lower equity) portfolios producing greater returns than higher risk (higher equity) portfolios. This is likely the result of bonds getting a post inversion boost as interest rates are lowered to combat economic slowing and stocks retreated due to that same economic slowing. Regardless, the hypothetical index portfolios have appeared to post positive results on average following yield curve inversion.
The Lehman Brothers bankruptcy and the inverted yield curve scenarios, both strong sell signals, are examples that timing cash moves around market events or certain conditions can be difficult. Conditions or events that investors may view as clear get out signals can be cloudier than thought.
The bottom line
The recent increase in market volatility has appeared to stir up questions about moving out of the market for the safety of cash. We may caution against market timing for most investors because that decision is often not rewarded. If investors ignore this and insist on doing something in the face of perceived increasing risk, one idea might be the temporary reduction of market exposure. Reducing the equity allocation by 10% - 20% may provide additional cushion if the market does pull back, and still provide participation if markets snap back quickly or don't draw down at all. One final consideration for those contemplating this path is to document the reasons for getting out and the catalyst for getting back in. These decisions are often driven by emotions and not by long-term perspective, so having a written plan in place may help improve the odds of success or mitigate the amount of harm made by a bad call.