
Executive summary:
- Election years add a dimension of uncertainty to the market and can result in volatility
- But history shows that a balanced portfolio has generally ended an election year with a positive return
- Regardless of which administration takes power after an election, a balanced portfolio has also made strong gains in the years immediately after
- Remaining invested has proven to be the best strategy to build wealth over the long term
Election years are always interesting. Candidates share their vision of the future, introduce new policies and battle their way to the White House. Regardless of the outcome, the uncertainty leading up to the vote can be unsettling for many investors. This uncertainty is often amplified by sensational media headlines, especially in the first half of an election year.
However, this volatility tends to dissipate as election day approaches and history has shown that markets generally finish the year unfazed. Looking back over the last 12 election years, a portfolio consisting of 60% stocks and 40% bonds:
- Finished in positive territory 11 times
- Generated an average return of 9.8%, and
- Delivered only one negative outcome, which was driven by the bursting of the historic housing bubble
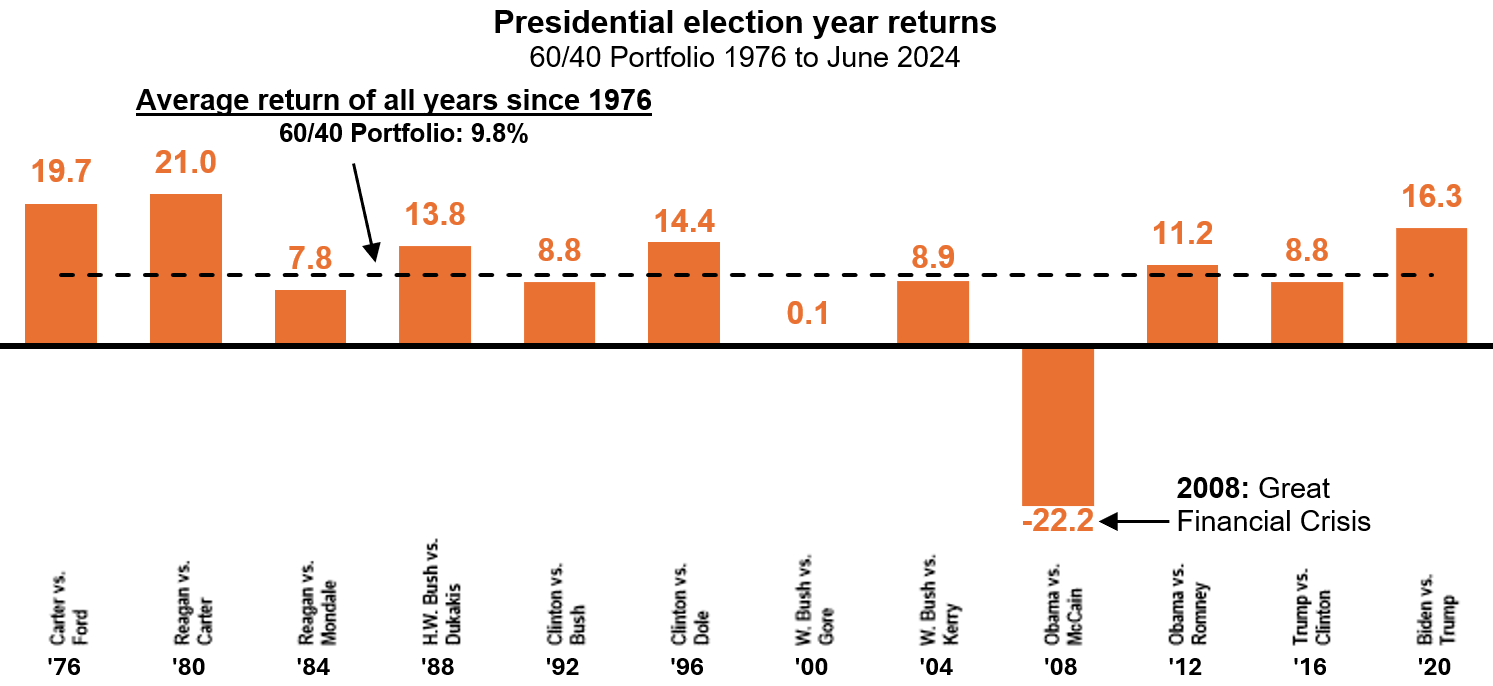
Source: The American Presidency Project & Morningstar Direct: 60/40 Portfolio: 60% U.S. Equity / 40% Bonds. U.S. Equity: Ibbotson U.S. Equity Index (1976-1983), Russell 3000 Index (1984 – Present). Bonds: Ibbotson Intermediate Bond Index (1976-1985) linked to Bloomberg U.S. Aggregate Bond Index (1986-Present). Indexes are unmanaged and cannot be invested in directly. Returns represent past performance, are not a guarantee of future performance, and are not indicative of any specific investment.
Investing after elections
But what happens after the new administration takes office and starts to enact its policies? To help illustrate that, we analyzed three scenarios that depict the average one-year and three-year gains of a $100,000 investment starting in the year following an election year.
- The first scenario (stay invested) includes a balanced allocation (60% equity/40% fixed income), where the investor stays true to their investment plan. This investor is rewarded for staying invested: they experienced gains averaging $12,300 and $35,200 over the one-year and three-year periods following an election year.
- The second scenario (wait to invest) assumes that same 60/40 investor wants to see how markets react to the new administration. This investor moves to cash for the first six months of the year following an election year, then subsequently moves back to their 60/40 allocation. Unfortunately, relative to an investor who stuck to their plan, their annualized return lagged the investor who stuck to their plan over both the one-year and three-year periods.
- The third scenario (cash) depicts an investor who could not bear to be invested due to the uncertainty under the newly appointed administration. This investor remains in cash in the years following the election and experienced an extreme setback to their overall ending wealth. Their gains over both the one-year and three-year periods were one-third that of the investor who remained invested.

Morningstar Direct. Time periods examined: 1977-1979, 1981-1983, 1985-1987, 1989-1991, 1993-1995, 1997-1999, 2001-2003, 2005-2007, 2009-2011, 2013-2015, 2017-2019. Equity: Ibbotson U.S. Equity Index (1975-1983), Russell 3000 Index (1984 – Present). Bonds: Ibbotson Intermediate Bond Index (1975-1985) linked to Bloomberg U.S. Aggregate Bond Index (1986-Present). Cash: Citigroup 1-3 Month T-Bill Index. Index returns represent past performance, are not a guarantee of future performance, and are not indicative of any specific investment. Indexes are unmanaged and cannot be invested in directly.
It’s important to note that the cash returns were well behind the balanced portfolio even including periods of relatively high interest rates. Below you will see the stark contrast of growth generated from period to period. In the measured three-year periods from 1977-1999 aggregate growth from holding cash was roughly $162,000, far higher than the $32,000 generated from 2001-2023. This concept would also apply to the "wait to invest" scenario, although to a lesser extent as the investor only held cash for six months out of each three-year investment cycle.
It’s true that interest rates currently are relatively high, but they aren’t as high as they were in the early 1980s, when cash still underperformed the balanced portfolio. And even though the current rate environment is higher than we have seen in 15 years, a 4.3% return on cash might be unrealistic to maintain going forward.
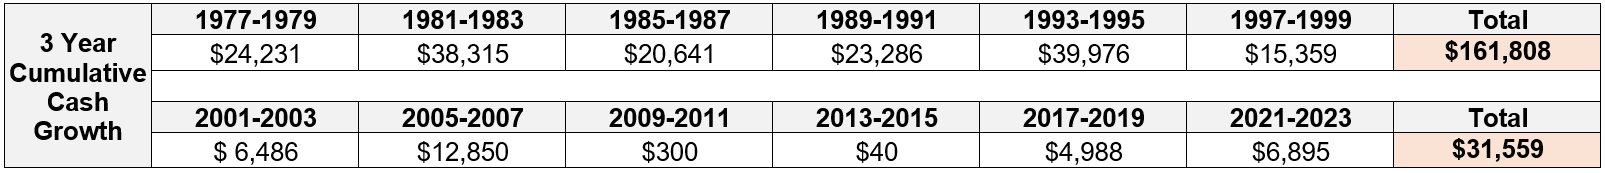
Source: Morningstar Direct. Based on growth of Citigroup 1-3 Month T-Bill Index for each three-year interval.
As we know, uncertainty driven by an election year may tempt investors to divert from their investment plan. Some may move to cash until they are comfortable with the market reaction to the newly appointed administration, and some may move to cash and never re-enter. Historically, moving to cash in any form has not been rewarded and "sticking to the plan" has offered the most direct path to achieving desired investment outcomes.
The bottom line
We’ve seen that investing during an election year and investing in the periods following election years have been quite strong, especially if you’ve stayed invested throughout. Using the same scenarios discussed previously, but considering an initial investment in January 1975, the outcome of staying invested throughout dwarfs moving to cash, even on a temporary basis.
The U.S. government is an extremely strong institution with well-designed built-in checks and balances that have served the country for more than 240 years. Markets recognize this and adapt, not only to election outcomes, but to general adversity. Showing your clients that the market tends to be influenced by economic cycles, rather than political party will do a great deal in helping you keep them invested.

Morningstar Direct, as of 7/31/2024. 60/40 Portfolio: 60% U.S. Equity / 40% Bonds. U.S. Equity: Ibbotson U.S. Equity Index (1975-1983), Russell 3000 Index (1984 – Present). Bonds: Ibbotson Intermediate Bond Index (1975-1985) linked to Bloomberg U.S. Aggregate Bond Index (1986-Present). Cash: Citigroup 1-3 Month T-Bill Index. *Wait to invest: First six months of period invested in cash then invested in 60% equity 40% fixed income portfolio for remainder of the period. Indexes are unmanaged and cannot be invested in directly. Returns represent past performance, are not a guarantee of future performance, and are not indicative of any specific investment.