PPA yield curve elections: A potential for change
Executive summary
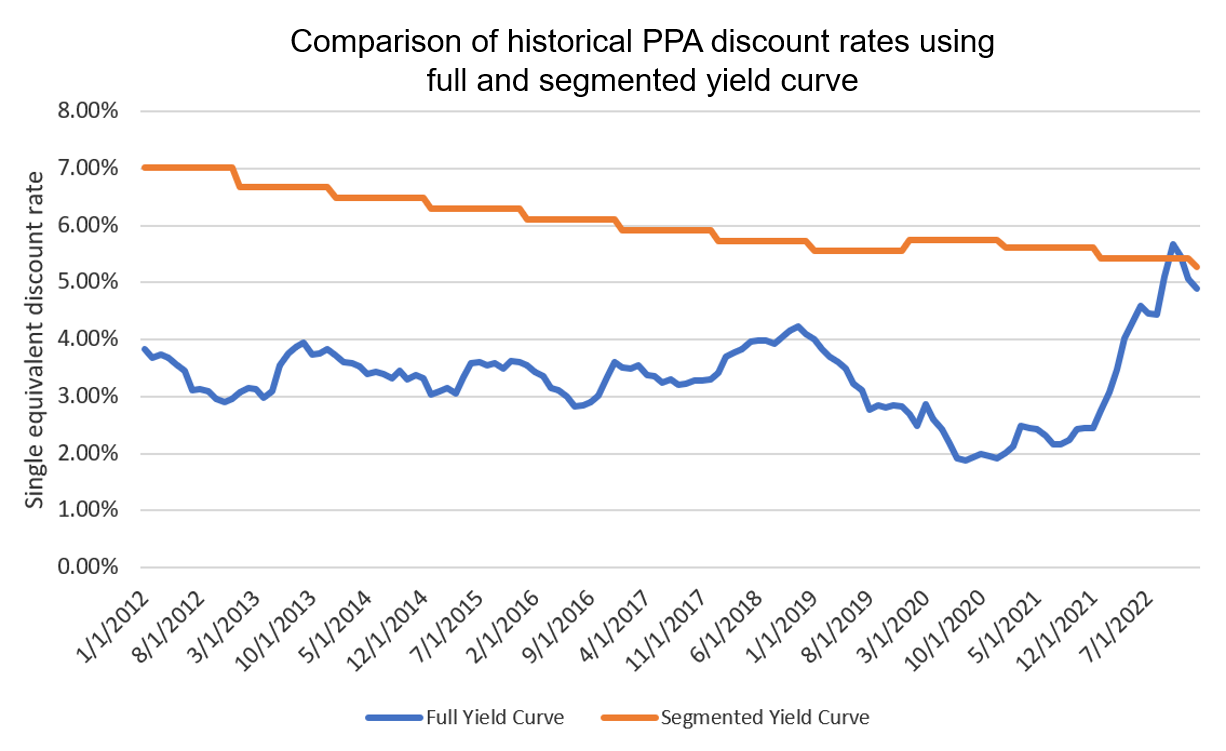
- With corporate bond yields up dramatically since 2022, the full and segmented yield curve methods used by DB plan sponsors are producing discount rates and liabilities at similar levels
- One of the most potentially impactful benefits to changing the yield curve election is the ability for sponsors to better align plan assets and liabilities in future years
- One main risk to changing to the full yield curve method is if market-based rates fall sharply, it could lead to large increases in the liability used for minimum funding purposes
With the sharp rise in corporate bond yields during 2023, corporate defined benefit (DB) plan sponsors may have reason to consider changing their Pension Protection Act (PPA) funding yield curve election for current and future plan years. The immediate impact to cash contribution levels is likely close to neutral, while factors such as current year PBGC variable rate premiums and 4010 filings, as well as the longer-term linkage between assets and liabilities, may provide enough benefits to make this a decision to at least examine.
A brief recap of corporate pension funding rules
The PPA allows plan sponsors the choice of two yield curve methodologies when valuing plan liabilities for minimum funding purposes. The simplest is referred to as the full yield curve, which is a curve constructed of the average daily corporate bond yields for the month prior to the beginning of the plan year. The second method, which is used by most plan sponsors, is termed the segmented yield curve. At its core, this consists of a 24-month average of the full yield curve, broken into three segment rates.1 Since the Global Financial Crisis, and most recently modified by the Infrastructure Inflation and Jobs Act, these segment rates have been subject to caps and floors centered around a 25-year average of corporate bond rates. Current law restricts each of the three segment rates to between 95% and 105% of this 25-year average, with each averaged segment being no lower than 5.0% This may cause the yield curve to significantly deviate from market interest rates.
Prior to 2022, this segmented yield curve produced substantially higher liability discount rates, and thus lower funding liabilities, than the full yield curve method, which is why historically most plan sponsors were happy to continue using the segmented yield curve. These lower liabilities led to smaller minimum required cash contributions, which afforded plan sponsors ample flexibility in deciding how to fund their plans. Now, however, with corporate bond yields having risen dramatically over 2022, the full and segmented yield curve methods are producing discount rates and liabilities at similar levels (see chart below). There is currently no large directional difference between the two methods, with the exact difference varying by the duration of the plan liabilities. We have spoken with several clients that are considering changing their yield curve method for various reasons. What follows are some potential benefits and pitfalls to be aware of if you find yourself in a similar situation.
Benefits and investment implications of changing yield curve election
Aside from the impact on the level of current plan year cash contributions, there are other theoretical benefits to changing the yield curve election. The most potentially impactful of these is the ability for the sponsor to better align the assets and liabilities of the plan in future years. As last year has shown us, there can be a disconnect between liabilities with excessive levels of smoothing and liability-hedging assets, even if there is some smoothing permitted in asset valuations per minimum funding rules.3 In 2022, we saw funding liabilities based on the averaged yield curve continue to rise while asset values fell sharply, leading to unexpected increases in required contributions for many plans. If a sponsor were to elect the full yield curve along with using an unsmoothed asset value, utilizing liability-driven investing (LDI) principles to better align asset and liability interest rate volatility can provide a smoother pattern of contributions going forward.
Moving to a more mark-to-market liability valuation methodology also better aligns the liability calculation across funding, PBGC, and accounting measures. Plan funding becomes better aligned with the true economic cost of the liability, which can provide a clearer picture of participant benefit security. Funding calculations also become better aligned with risk transfer and other liability defeasance activity, as insurance companies value liabilities more in line with GAAP accounting measures.
From a cost perspective, electing to use the full yield curve can have a dramatic impact on the amount of PBGC variable rate premium (VRP) paid for this plan year. As with the minimum funding calculation, the PBGC variable rate filing allows for the choice between a market-based and smoothed yield curve. In this case, the market-based curve is the same as that used in the funding calculation, but the smoothed rate ignores the 25-year average and corridors described above, instead only using the 24-month average of the full yield curve. This leads to lower discount rates than both the full yield curve and segmented rates used for funding purposes. Given rising yields in 2022, the full yield curve election will produce a lower liability and (potentially substantially) smaller PBGC VRP.
Plan sponsors have the option to change between these two PBGC methods, but only once every five years. If the most recent change has been made within the last five years, meaning the option to switch to the full yield curve is not available, electing to use the full curve for funding purposes is a way around not having that option available. The PBGC VRP yield curve defaults to that used for the minimum required calculation if the full yield curve is elected, regardless of the availability of the 5-year election window (reasons for this are discussed in the potential pitfalls section below).
Similarly, PBGC 4010 filing requirements are based on the funding yield curve election, again without use of 25-year averaging and corridors, so changing to the full yield curve valuation method can improve funding levels on this basis and allow sponsors to potentially avoid the work that goes into this filing.
Pitfalls to changing yield curve election
The main risk to changing to the full yield curve is the same as the one that led to the introduction of the long rate smoothing window and corridors:4 market-based rates falling sharply, leading to large increases in the liability used for minimum funding purposes. In this scenario, continuing to use the average segmented curve would result in lower minimum required contributions. We believe that many of these risks can be lessened with a well-designed investment strategy, especially since LDI strategies are already more widely used in DB asset allocations than in the period leading up to and immediately following the GFC. This may be especially impactful for plans that are at or near a hibernation state, with relatively low equity allocations and high interest rate hedge ratios.
To stop DB plans from gaming the system and constantly selecting the highest available discount rate, the PPA only allows elections to move from the average segmented method to the full yield curve. Going in the other direction, from full to averaged, requires a submission by the sponsor and subsequent approval by regulators, meaning for all intents and purposes this is an irrevocable change. Thus, it is imperative to fully consider not just the immediate benefits of such a change but the potential long-term implications as well. This requires conversation and collaboration between the sponsor, the plan actuary, and the plan's investment consultant or OCIO to understand where risks might arise and design an asset allocation to support the long-term funding goals and risk tolerance of the sponsoring organization.
1 The first segment is used to discount years 1-5 of projected liability cash flows, the second years 6-20, and the third years 21+.
2 Calculated by discounting a representative series of liability cash flows with a duration of approximately 12 years as of 12/31/2022 against the monthly full and segmented PPA yield curves, and calculating the equivalent single discount rate.
3 Current PPA rules allow for 2-year smoothing of asset gains and losses, which does not always align with a 25-year average discount rate that also employs caps and floors.
4 It was the speedy decline in corporate bond yields immediately following the worst of the Global Financial Crisis that initially prompted many plan sponsors to elect to use smoothed discount rates.