Real world overlay solutions in challenging times
With only a few brief downturns in an otherwise upward trend in the U.S. equity market since the Global Financial Crisis, declining interest rates have pulled forward the net present value of distant earnings and propelled growth stocks (and the market as a whole) higher. Perhaps outsized gains in equity and fixed income markets over this period most likely come with a price: reduced forward-looking return expectations.
Even if we assume long term equity returns will be near recent historical levels—which involves a very strong argument on the power of innovation—Treasuries will be challenged to contribute much to portfolio expected return over the coming decade. Credit spreads of various forms have produced decent risk-adjusted returns in the past, but they bear risks highly correlated to equity markets. This alignment of portfolio risks poses several key questions:
- Where do we turn for increased returns?
- How much risk can we tolerate in reaching those returns?
- Do we rely too much on equity-centric risks to generate returns?
- How do we mitigate damage from wealth-destroying drawdowns?
An effective investment policy outlines the portfolio structure needed to generate required returns over time, and allowable ranges around asset class targets approved by the oversight body. Most notably, it is the usual benchmark for assessing relative success of an investment staff. Diligent risk control can allow for greater conviction in holding return seeking assets without creating undue risk to the investment policy.
Here are three current themes demonstrating how an overlay program can be a critical tool for success:
1. Diversifying is more important and more challenging than ever
Improved diversification at the total portfolio level can enhance long term expected returns and reduce drawdown risk over periods where equity markets are correcting. An investment policy that allows for some degree of leverage is an uncomfortable step for some, but a powerful one that is worth consideration. Unfunded overlay exposures on top of current strategic allocations can benefit Sharpe ratio and downside response. Leverage allows for this diversification without overriding the strategic allocations that generate expected returns over the longer term. The utility of Treasury exposure differs for different investor types.
- In the case of corporate defined benefit (DB) plans, Treasury futures manage the surplus risk to liabilities. This is where the very recent back up in rates has increased the attractiveness of liability-driven investing (LDI) hedging.
- In the case of asset space investors (e.g., public DB funds, hospital operating funds, endowments, and foundations), Treasury futures can help manage drawdown risk. While the efficacy of the diversification benefit from Treasuries is lower from today's starting yields, there is still a portfolio benefit to consider.
With a low expected return, this critical exposure (for hedging against deflationary shocks) can get squeezed out of the portfolio if it cannot be accessed via an overlay program. Over the longer term, long-dated Treasury futures have been great diversifiers to global equity market risk [as represented by MSCI All Country World Index (ACWI)]. This is particularly easy to see when observing the rolling one-year return chart in Exhibit 1, as it cuts through the noise of shorter return periods. The shaded areas highlight particularly beneficial shock diversification periods with negative equity market returns.
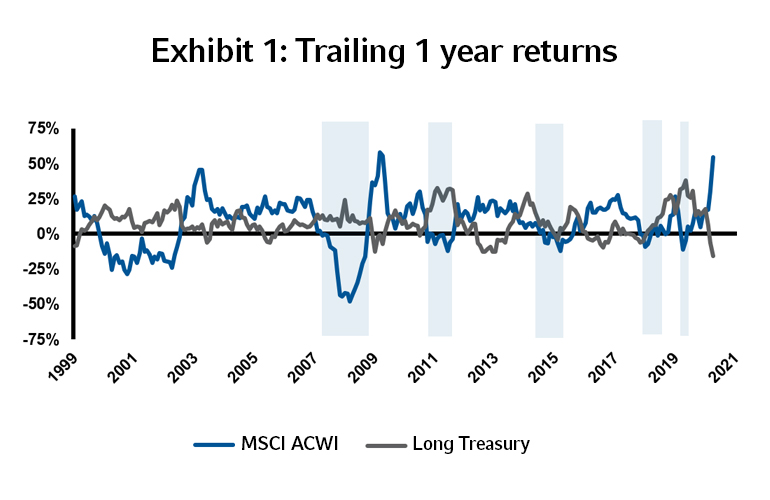
Source: Bloomberg and Russell Investments. Data spans 12/31/1999 to 3/31/2021.
In recognition that the disinflationary environment that has long benefited bonds will eventually shift to one of reflation, we have increased our research efforts on diversification. Much of this focus has been in commodity exposures¹. Here are a few examples:
- Broad commodity exposure (generally via total return swap) is the secular trend of disinflation over the past four decades and it has not been kind to collateralized commodity futures returns. Looking forward, commodities could be a stronger beneficiary of any reflation that occurs. Active management can also target alpha on top of the passive index exposure.
- Specific exposures in liquid commodity futures (e.g., oil or metals) allows for more targeted views to capture potential spot price increases, or to earn positive roll yield in cases where the futures curve is in a state of backwardation².
- Commodity Trading Advisor (CTA) or other dynamic strategies can use long/short exposure in futures to create a less correlated return pattern to equities and/or provide tail-hedging benefits.
- Dynamically managed, return-enhancing currency exposures - can improve the reward-to-risk balance from their currency exposure by tilting toward factors that we believe will be rewarded with positive expected returns. Carry, value and trend are three factors that offer meaningful (and relatively uncorrelated) return sources. We implement currency factor strategies by taking long-short positions in deliverable currency forwards, which are capital-efficient instruments and currently do not require margining.
2. Focus on winning by not losing
Nothing can be more frustrating than getting the big calls correct, yet still not winning with the total portfolio result. Unlike security selection in a conventional equity portfolio, where many small bets of equal conviction can improve the information ratio of a portfolio, tactical asset allocation (TAA) success (particularly into and out of risky assets) works best in high conviction situations. Our research has shown that a risk-on tactical position, after a correction ending in investor capitulation, tends to offer less regret risk than reducing risky asset exposure after a prolonged run to lofty valuations (and missing the remaining gains before the market tops).
Here is how this applies to an overlay in today's environment:
- Asset drift results in unintended tactical positions. While the momentum can work for some time, its eventual failure is almost as certain as the law of gravity holding in Newtonian physics. When unintended exposures work against you in retrospect, they can offset or dwarf the potential gains from informed, active decisions over time.
- Correcting asset drift via overlay. While we have historically run range-based rebalancing programs for our overlay clients to ensure disciplined risk reduction to policy, we are also open to month-end rebalancing as directed by a client to remove all or part of an equity overweight to policy. The overlay allows underlying accounts with asset managers to remain in place and reduces overweight (or increases underweight) asset classes with short (or long) futures positions.
- Momentum vs. risk reduction to policy. With elevated volatility, the cost of leaving a residual equity overweight in place has a greater impact on total portfolio risk. A material overweight to equity should be confirmed by a powerful tactical signal to warrant that risk.
- Real risk reduction over time. Our rebalancing overlay composite consistently shows risk reduction (from asset allocation deviations to policy)³. Calendar year risk reduction has ranged between 55% and 85% across the entire composite of accounts over the past decade, as seen in Exhibit 2.
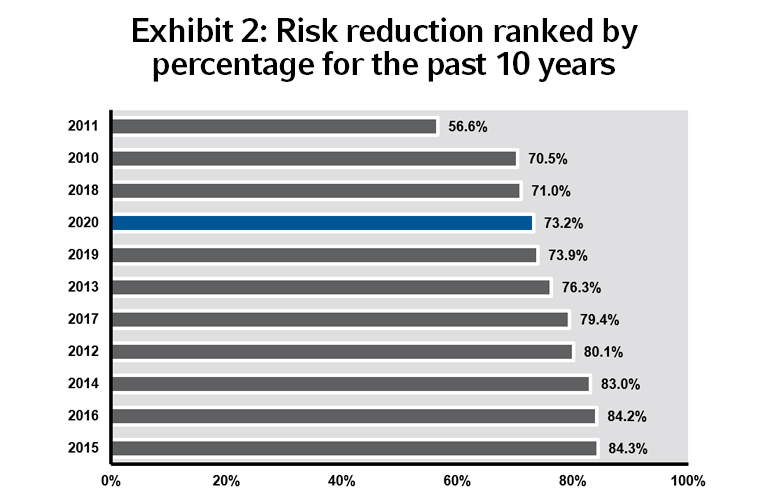
Source: Russell Investments. Data spans 1/1/2010 to 12/31/2020.
- Positive return impact from overlay. Understanding the overlay's return contribution requires proper context. The overlay is designed to complement the asset class exposures elsewhere in the portfolio in a way that is more consistent with policy targets. Exhibit 3 shows the month by month impact of our composite of systematic rebalancing clients. The figure shows monthly return contributions from overlay positions (in blue) as well as the return from underlying positioning relative to the target that would have existed without the overlay (in gray). Small return residuals (in red) indicate noise from bands and timing differences in making such corrections via an overlay.
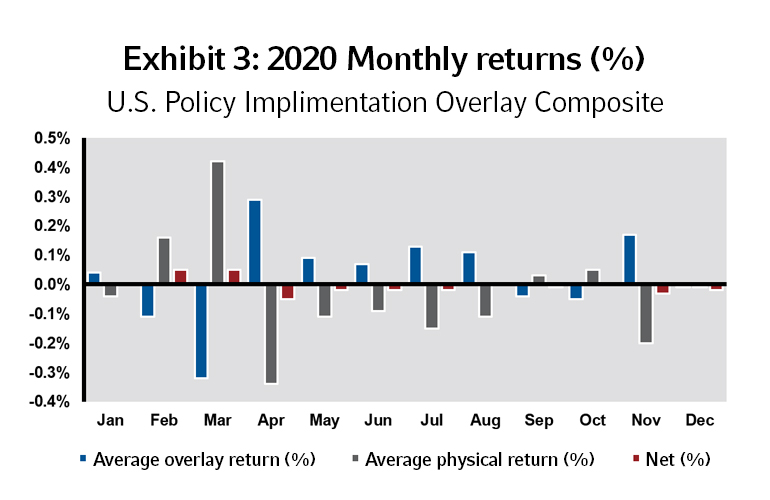
Source: Russell Investments. Data spans 1/1/2020 to 12/31/2020.
A rebalancing overlay assesses the amount of available cash on a daily basis, wherever it might sit within the accounts of the plan. As cash rises, long futures are added in the underweight asset class. As cash falls, short futures remove exposure to the overweight asset class. In effect, it is a multipurpose, liquidity-management program that eliminates cash drag and allows for available cash buffer to fund benefit payment or investment needs. Known flows can be adjusted for in real time (rather than on previous day’s custody balances), so transient risk from manager portfolio restructuring can be coordinated in lock-step with the overlay.
3. Liquidity is typically not a problem until it becomes the major problem
An overlay program is a great tool for liquidity planning in that it separates operational cash needs from the need to have investment exposure to low-yielding cash. However, it can also create a liquidity mismatch with the need to move variation margin daily. Long equity futures can demand additional settled cash for variation margin in a severe market correction (compared to physical equity that would go down in value, but not generate a need for cash) so it becomes all the more important to prepare for liquidity in a plan with an overlay.
If one is nervous about a market top, prepare for it by coordinating physical and overlay positions such that an equity correction will generate liquidity from the overlay (short equity futures and long Treasury futures). Downside-risk hedges also generate liquidity under market stress (as well as offsetting market declines). It is prudent to tier liquidity sources in the portfolio, such that liquidity demands never have to override investment concerns in portfolio decisions.
The bottom line
Maintaining a modern, multi-manager investment program is challenging in good times and can become overwhelming when markets behave badly. Sooner or later, there will be another correction and a subsequent recovery—it is the nature of risk-taking and markets. Pinpointing the time of that next correction (or the span and nature of the recovery from it) is nearly impossible without the benefit of hindsight.
Our overlay team can focus on critical components of blocking and tackling, which takes time and must be a continual focus of a daily process. There are very few investment staffs that are resourced to look at these details with the discipline required and to subsequently act on them when necessary. Russell Investments’ overlay services team stands ready to assist in this regard so staff can focus on core investment management activities.
¹The shape of the commodity futures curve is based primarily on supply and demand – who demands more certainty of price in the future, producers or consumers? A supply/demand imbalance will persist until capacity adjustments are made by major resource producers. In capital intensive industries (such as basic resources), this capacity adjustment can take several years to bring capacity online or work off overcapacity. A futures curve in backwardation involves a positive roll yield for the long futures holder. The opposite is true for a market in contango. A market in contango allows producers to hedge future production by selling forward at a higher price. Another way to access economic exposure to commodities with a negative roll yield is via equity investment in companies that produce them. We have evaluated ETFs or sub-indices that can be accessed in funded or unfunded form (with a total return swap for those clients that can trade OTC derivatives) to access such equity exposures.
²See endnote 1.
³While these figures are based on a composite of accounts and individual account factors may have resulted in some disparity of results based on the starting positioning in each client’s specific case. Russell Investments composite of Policy Implementation accounts includes 27 U.S. overlay clients representing $402 billion of underlying AUM covered by the overlay (as of 12/31/2020).