Has the pandemic boosted the longer-term performance of hedge funds?
Recent hedge fund results have been strong in the era of COVID-19, with the HFR Fund Weighted Index returning 27.5% for the year ending June 30, 2021 and 10.1% year-to-date. But what has this meant for longer-term hedge fund results, which not too long ago were being called into question? Have the uncertainties of the pandemic helped bolster performance?
The evaluation framework
In 2019, we published Hedge funds for the future: Evaluating hedge fund performance in the decade since the global financial crisis, a research paper which provided a holistic framework of five objectives with which to evaluate hedge fund performance:
- Annualized returns between aggregate bonds and global developed public equity combined with volatility closer to that of aggregate bonds
- Returns between 3-month Treasury bills +3-5% over a market cycle
- Downside management when public equity market returns are negative combined with participation in positive returning markets
- Beta of about 1/3 relative to public equity markets
- Sharpe ratio at least equal to public equity (i.e., better risk-adjusted returns)
Using this framework for evaluation, the paper evaluated hedge fund performance over multiple time periods, including the five- and 10-year periods ending Dec. 31, 2018. The conclusion was that over this 10-year period, hedge fund results met all five objectives. However, over the five-year period at the same end point, hedge funds met only two of the five objectives (objectives 3 and 4), missing the critical first objective.
The results post-pandemic
Overall, hedge funds have played the important role of downside management with upside participation during the COVID-19 pandemic.
Revisiting our evaluation as of June 30, 2021, strong outcomes in recent years have led to post-pandemic five- and 10-year hedge fund results which exceeded the framework objectives:
- Over the five-year period, hedge funds results met all five objectives
- Over the 10-year period, hedge funds results met all five objectives
- A third long-term evaluation period was included, extending from January 2008 to June 2021. Over this time period, hedge funds met all five objectives. However, the margins were slimmer and may not have overcome an implementation fee hurdle
Summary of results over all time periods
| POST-PANDEMIC RESULTS | PRE-PANDEMIC RESULTS | ||||
| OBJECTIVE | 5 years ending June 30, 2021 |
10 years ending June 30, 2021 |
January 2008 - June 2021 |
5 years ending 12/31/2018 |
10 years ending 12/31/2018 |
| 1. Annualized returns between… | ✓ | ✓ | ✓ | X | ✓ |
| 2. T-Bills +3-5%... | ✓ | ✓ | ✓ | X | ✓ |
| 3. Downside management… | ✓ | ✓ | ✓ | ✓ | ✓ |
| 4. Equity beta… | ✓ | ✓ | ✓ | ✓ | ✓ |
| 5. Sharpe Ratio… | ✓ | ✓ | ✓ | X | ✓ |
✓ = Objective met X = Objective not met
The post-pandemic evaluation details
For simplicity, the updated evaluation was conducted gross of implementation fees; the original evaluation included a 75 basis-point implementation fee assumption. Return differences are noted so that investors can calibrate the results to their actual fees. Diversified hedge funds are represented by the HFR Fund Weighted Index, global developed public equity by the MSCI World Index net dividend and bonds by the Bloomberg U.S. Aggregate Bond Index.
- Annualized returns between aggregate bonds and global developed public equity combined with volatility closer to that of aggregate bonds
- Hedge funds met this objective over the five- and 10-year periods, returning 490 basis points (bps) and 170 bps per annum over bonds, respectively
- Over the 2008-2021 time period, hedge funds outperformed bonds by 50 bps per annum and, therefore, may or may not have cleared this hurdle net of all fees
Click image to enlarge
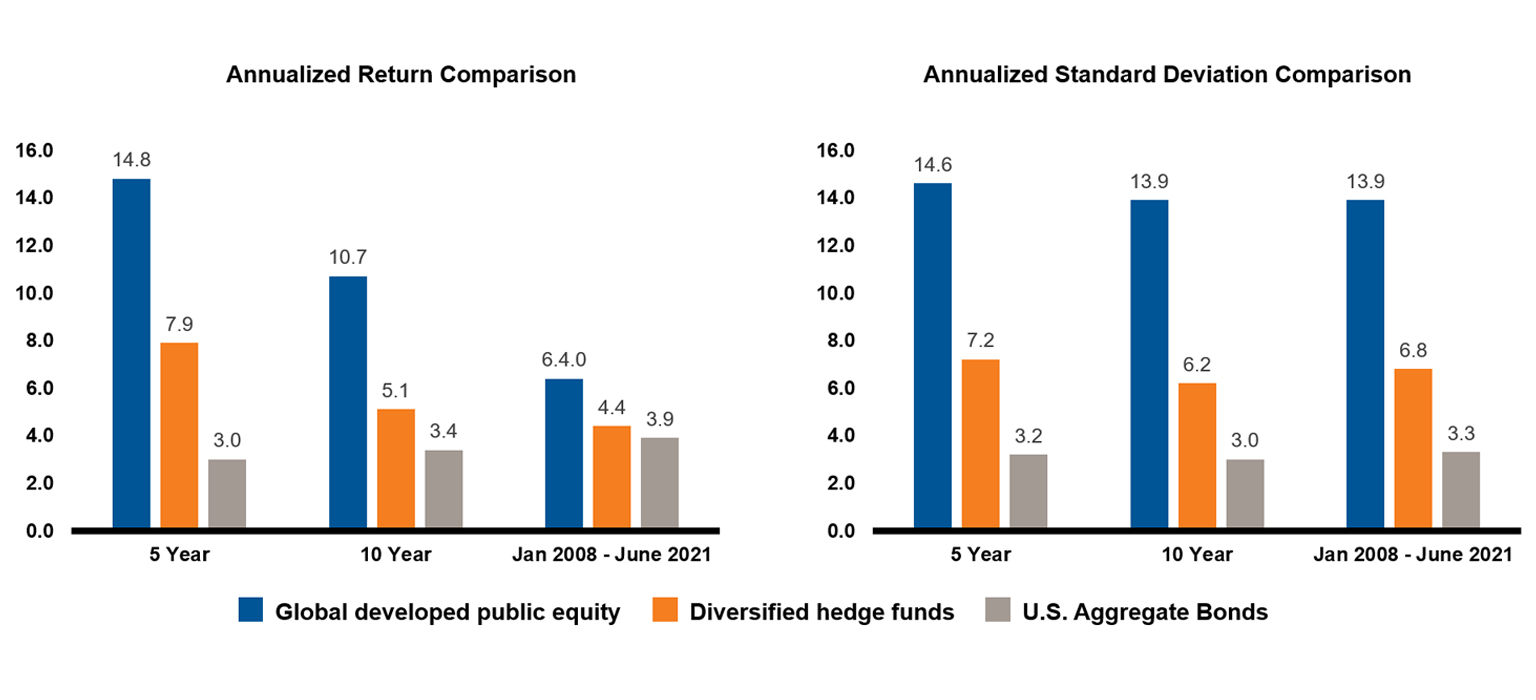
Source HFRI, MSCI, Bloomberg. For illustrative purposes only.
- Returns between 3-month Treasury Bills +3-5% over a market cycle
- Hedge funds delivered 370 bps and 140 bps per annum over T-Bills +3% for the five- and 10-year periods, respectively
- Over the five-year period, hedge funds returned 160 bps per annum over T-Bills +5%
- Over the 2008-2021 period, hedge funds outperformed T-Bills +3% by 70 bps per annum
Click image to enlarge
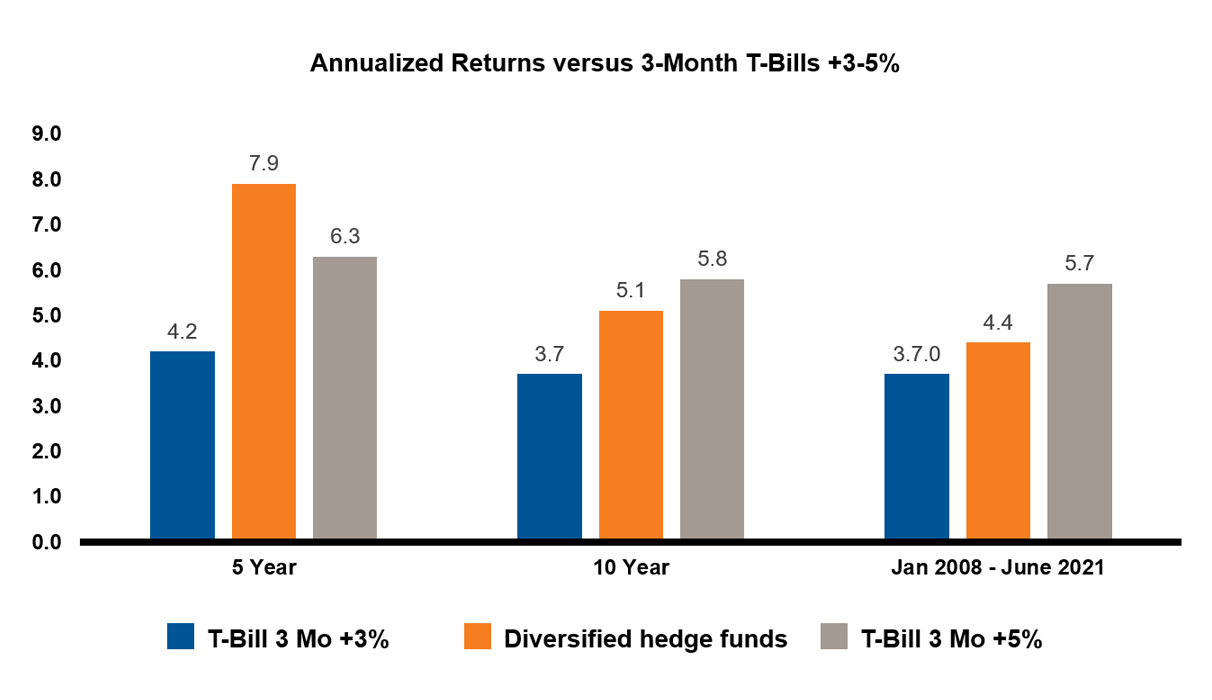
Source: HFRI & MSCI. For illustrative purposes only.
- Downside management when public equity market returns are negative combined with participation in positive returning markets
- Over the time periods evaluated, hedge funds captured a higher percent of up-market than down-market performance
Click image to enlarge
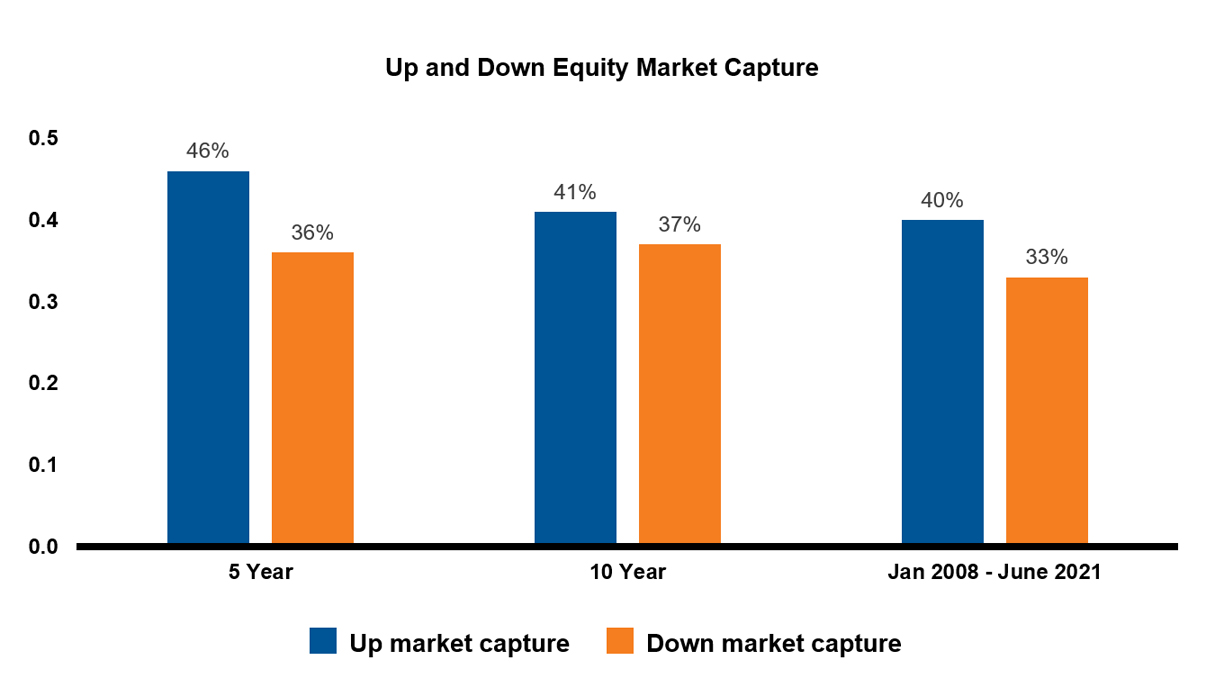
Source: HFRI & MSCI. For illustrative purposes only.
- Beta of about 1/3 relative to public equity
- Beta was slightly higher than 0.33 over all time periods evaluated
- This is higher than what was observed in the original evaluation, but within expectations given the elevated market volatility experienced with the impact of COVID
Click image to enlarge
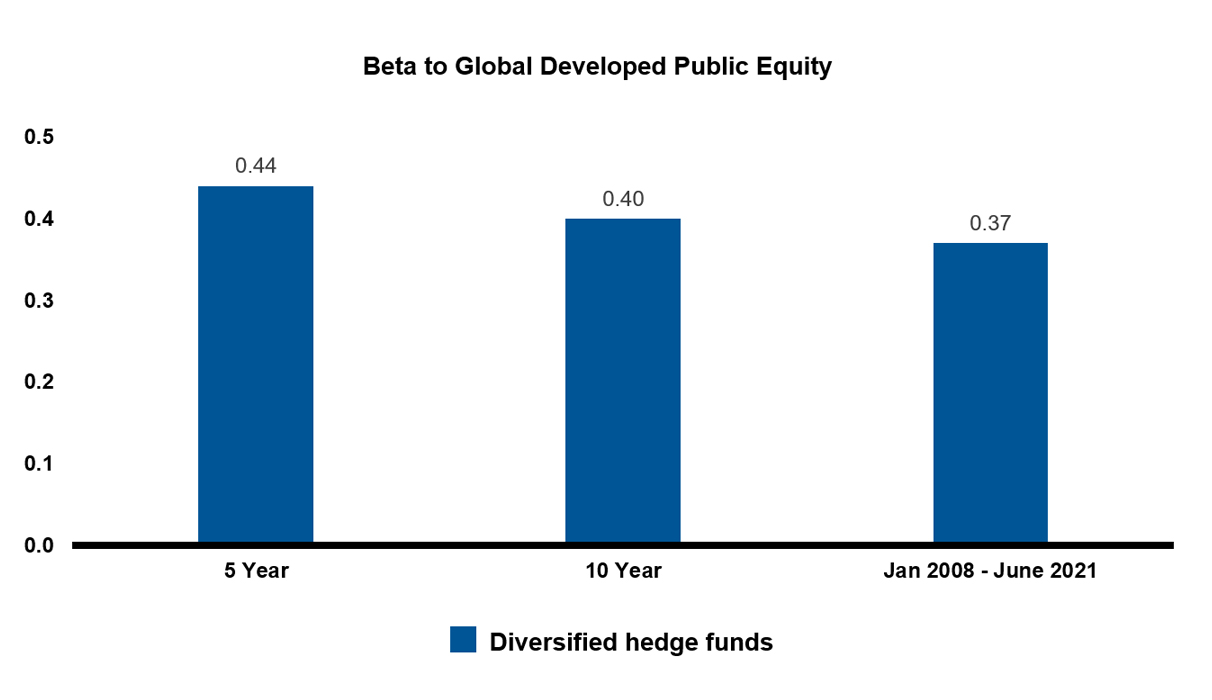
Source: HFRI & MSCI. For illustrative purposes only.
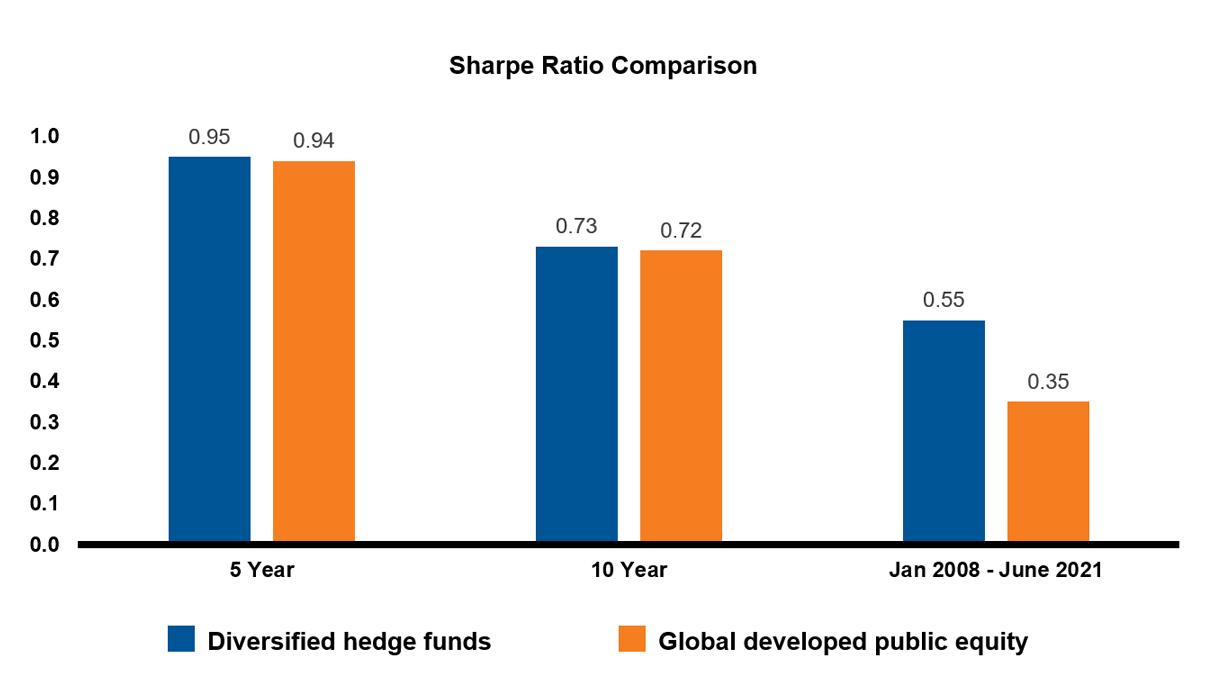
- Sharpe ratio at least equal to public equity
- Over the five- and 10-year periods, hedge funds met this objective with a Sharpe ratio equal to public equity, though net-of-fees, this objective may have been missed. Sharpe ratios were notably high for both hedge funds and public equity
- Over the 2008-2021 period, hedge funds provided a Sharpe ratio higher than global developed public equity
Click image to enlarge
Source: HFRI & MSCI. For illustrative purposes only.
The bottom line
The results of our updated evaluation suggest that longer-term hedge fund performance has improved during the pandemic. Amid this backdrop, we continue to believe that hedge funds can play an important role in multi-asset portfolios for institutional investors seeking exposure to alternative investments.