Canadian housing prices: Can they keep going higher?
It is the subject of countless discussions around dinner tables, board tables, online forums, newspaper columns and neighborhood gathering spots. Can Canadian home prices continue their white-hot pace of gains?
The answer is: that depends.
Housing prices have been supported by two key factors:
1-low interest rates
2-population growth
Housing prices are at risk from two key factors:
1-High household debt
2-Potentially higher debt servicing costs
Which will hold the upper hand? Let’s take a closer look.
So far, nothing has seemed to stand in the way of rising house prices here. Even with the sharp plunge in economic activity when COVID-19 hit in early 2020, housing prices continued to march higher. Indeed, house prices globally rose throughout the pandemic, bucking the tradition of housing moving in line with economic growth. The only exceptions were Italy, Japan, and Finland.
To the surprise of no one who lives here, the hottest housing market since the pandemic began has been Canada. From the fourth quarter of 2019 to the end of March 2021, Canadian home prices rose 23.7% compared to the global average of 6.8%, and the U.S. at 6.2%.1 Low interest rates, exceptional policy support, and the desire for more space are a few reasons contributing to this trend.
Housing markets are usually cyclical, and an economic slowdown is typically associated with a reduction in housing activity. But the Global Financial Crisis (GFC) had a disproportionate impact on the U.S. housing market (Chart 1) compared to Canada (Chart 2). Recall that the GFC centered on the collapse of U.S. residential real estate, and therefore U.S. housing experienced a deeper and more drawn-out contraction than Canada did. Canadian housing was quick to bounce back, mainly because neither household finances nor bank balance sheets were impaired as in the U.S. This allowed the Canadian housing market to rapidly recover, with yearly change turning positive by late 2009. That did not occur in the U.S. until mid-2012.
Click image to enlarge
Chart 1
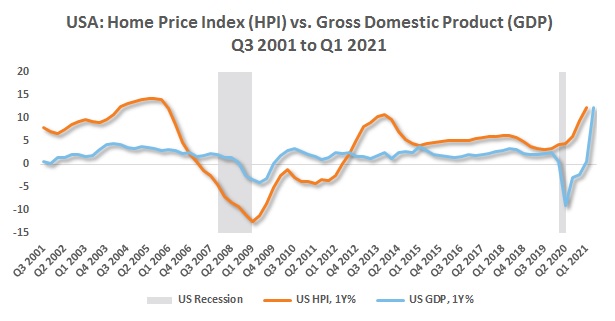
Chart 2
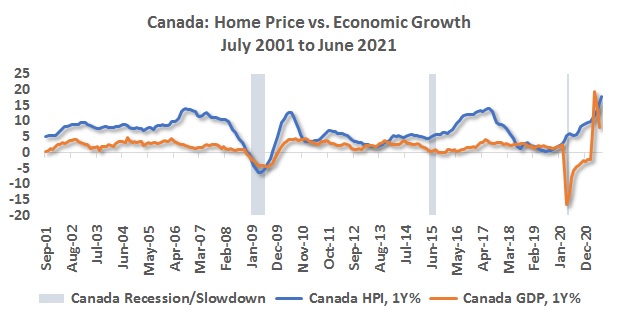
Source: Refinitiv DataStream, Russell Investments. As of June 30, 2021. Home price based on: US = S&P/Case Shiller National Home Price Index, Canada = Teranet National Bank House Price Index.
GDP=Gross Domestic Product
Low interest rates
Housing is one of the most interest-rate sensitive assets around. It typically benefits when interest rates are low or declining and struggles when rates are high or rising. The Government of Canada 5-year benchmark bond yield declined following the GFC, from around 4% in 2008 to about 0.85% as of September 21, 2021. As interest rates have trended down, the general direction for home sales and prices has been up.
Population growth
If the health of the Canadian banking system allowed for a swift recovery of its housing activity, population growth propelled it further. Leading up to the 2008 financial crisis, Canadian and U.S. population growth rates were similar at around 1% annually. Population growth in the U.S. has since trended lower and is currently less than half the pre-GFC pace at about 0.4% annually. However, in Canada, population growth floated around 1% a year even after 2008 and has accelerated since 2017 due to the Liberal government's more aggressive immigration targets. Before the pandemic shut its borders, Canadian population growth reached 1.5% annually, the best level since the early 1990s.
Click image to enlarge
Chart 3
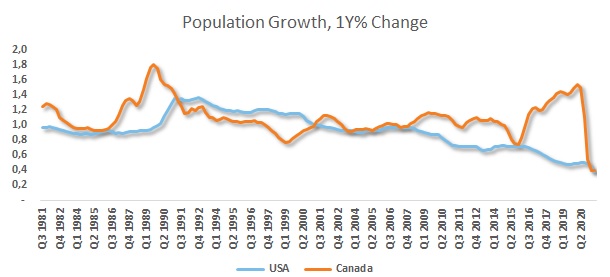
Source: Refinitiv DataStream, Russell Investments. As of Q2 2021.
Have we reached the tipping point?
While more expensive homes are great for the owners whose net worth gets a lift, it is painful for new buyers, particularly if the increase in home prices wasn't matched by higher incomes. Canadian home prices have appreciated by an average of 5% annually, double the pace of the average increase in household income. This is the opposite of the U.S. experience, where household income growth outstripped home prices by a wide margin: 1.7% versus 0.5%, respectively. The consequence is that Canadian home prices are quite inflated relative to the average Canadian household income, in an absolute sense and also when compared with the U.S. Home prices in Canada are 6.7 times the level of household income. That same ratio is 4.5 for the U.S.
Click image to enlarge
Chart 4
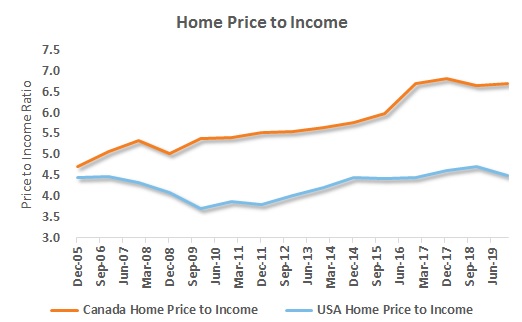
Source: Dallas Fed, Refinitiv DataStream, Canadian Real Estate Association (CREA), Russell Investments. As of December 2019.
Data over the last several months are signaling that housing trends have cooled since the start of the year. (See Chart 5) This suggests that home prices may have reached a level that could discourage potential buyers, especially those entering the market for the first time.
Considering recent price gains and the stretched home-to-income ratio, it may seem like the obvious conclusion is that Canadian home prices are not sustainable. However, a word of caution is warranted. Soaring valuations over the years have lured many to conclude an imminent downturn for the Canadian housing market, and with hindsight, that's unequivocally been the wrong view to have.
Moreover, "runaway" home prices are not just a Canadian phenomenon. Housing markets in Australia and New Zealand, for example, have experienced similar price appreciation and are also grappling with comparable debt dynamics. So even though prices may be defying logic, they could potentially grind higher under the right circumstances. Now let’s look at how vulnerable the housing market may be.
Click image to enlarge
Chart 5
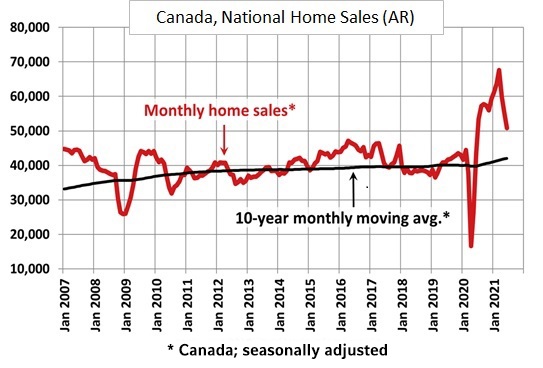
AR=Annualized Rate
Source: Refinitiv DataStream, Canadian Real Estate Association (CREA), Russell Investments. As of June 2021.
Excessive debt raises vulnerabilities, and by this measure, Canada stands out. Chart 6 plots the household debt to GDP (HHD/GDP) ratio for Canada and the U.S. Both countries were at similar levels back in 2010 with the respective HHD/GDP ratio at around 94%. However, after the GFC, debt levels steadily declined for the average American household – HHD/GDP fell from 94% to 78% as of the end of June 2021. HHD/GDP never declined in Canada after the GFC shock, and Canadian household debt to GDP stood at an alarming 111% as of the end of June 2021. (Chart 6)
Still, total debt isn’t as critical as the ability to service that debt. The debt service ratio (DSR) measures debt servicing costs (principal and interest) relative to disposable income. The higher the DSR, the more burdensome the debt load for the average household.
Since interest rates have trended lower over the past decade, reducing financing costs, the DSR should also be lower. Shown in Chart 7, the DSR in the U.S. declined from roughly 13% from the pre-GFC peak to 8%, but the DSR in Canada was at 14.7% in 2008 and has only declined to 13.5% as of the end of June 2021. Both U.S. and Canadian households benefited from pandemic-related fiscal transfers and debt forbearance which triggered the sudden drop in the DSR, but the impact of these measures haven’t materially improved the DSR of the average Canadian household. This is mainly because of the persistent growth in Canadian home values and therefore higher debt loads.
Click image to enlarge
Chart 6
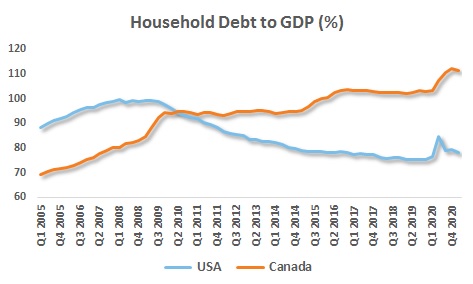
Chart 7

Source: Refinitiv DataStream, Russell Investments. As of June 2021.
High household debt relative to the size of its economy, coupled with elevated debt servicing costs, presumably makes the Canadian housing market much more vulnerable than the U.S. to an economic shock or, more critically, a spike in interest rates.
Housing Market vs. Equity Market
What would have been a better investment back in 1999? A detached home in one of Canada’s largest cities or the country’s key equity index – the S&P/TSX Composite Index?
For those observers who have seen Canadian home prices climb sharply over the past two decades, the answer may come as a surprise.
Even with several bear markets over the period — the 2000s dot-com bust, the 2008 GFC, the 2014 oil price shock, and, most recently, the global coronavirus pandemic – Canadian equities have held their own against one of the world’s hottest housing markets. (See Chart 8) Some provinces, namely British Columbia and Ontario, have fared better than others, but real estate has not been the definitive winner the headlines may have made it appear. Indeed, Canadian equities have outperformed average house prices here.
Yet again, the U.S. experience is quite different. Using the same starting point of March 1999, Chart 9 shows that the U.S. equity market recovery after the dot-com bust in the early 2000s was shallower relative to Canadian equities, despite a similar drawdown. In hindsight, the Global Financial Crisis was a decisive moment for U.S. financial markets, given the steady decline in interest rates since then and the U.S. Federal Reserve's asset purchase program, also known as Quantitative Easing (QE). This unprecedented accommodation has resulted in a decade-plus bull market for U.S. equities – one of the best globally over this period – that was only briefly interrupted by the pandemic. Therefore, despite the slow start, as of the end of June, U.S. equities have outperformed U.S. housing since 1999.
Click image to enlarge
Chart 8
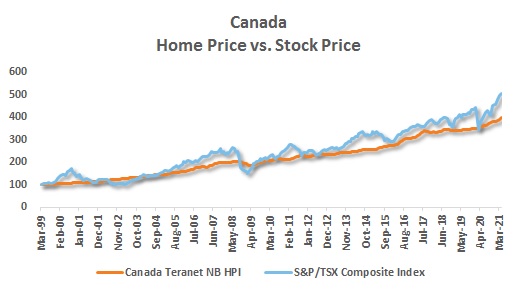
Chart 9
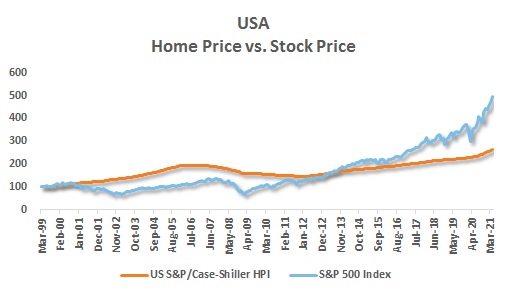
Source: Refinitiv DataStream, Russell Investments. as of June 2021.
Cumulative growth, rebased to 100 as of March 1999. Indexes are unmanaged and cannot be invested in directly. Past performance is not indicative of future results.
Concluding thoughts
We’ve demonstrated that housing will ebb and flow with the business cycle, and even though the business cycle remains positive, the Canadian housing market may have entered a cooling-off period. How long it lasts remains to be seen. Still, these are unusual times, and it's clear the housing market has behaved in ways that are not typical during a recession. It will be crucial to monitor both central bank and federal government policy:
- The Bank of Canada (BoC): The BoC influences mortgage rates, and Governor Tiff Macklem has indicated the Bank’s intention to raise the targeted policy rate, potentially as soon as the second half of 2022.
- Federal Policy: The newly re-elected Liberal minority government is seeking policies that aid first-time home buyers, reduces price speculation, curtail foreign purchases, and boosts housing supply.
While the federal government policies are targeted to reign in housing speculation and make housing more accessible, particularly for first-time homebuyers, the BoC is signaling that interest rates will go higher, which could deter some prospective borrowers. Therefore, the net effect is less clear. What's more apparent is that Canadian households are significantly more vulnerable to an economic shock than the U.S. due to the enormous debt burden. And at the risk of sounding like a broken record, this vulnerability is the most significant longer-term risk to the Canadian economy. Nevertheless, a positive business cycle and low interest rates may continue to keep the Canadian housing engine chugging along over the medium term.
1Source: US = S&P/Case Shiller National Home Price Index, Canada = Teranet National Bank House Price Index.