Expanding (investment) horizons: The case for investing globally
Executive summary:
- U.S. equities have ruled the roost for the better part of the last decade, but another region may emerge as the leader if the business cycle changes.
- The decision to allocate investments between the U.S. and international markets is not a binary choice. It's important to understand that there are opportunities in both.
- For investors considering investing in global equities, we believe active management and skillful security selection are paramount.
"The only constant is change" – Heraclitus.
Heraclitus, the Greek philosopher, famously stated that "the only constant is change," a maxim that may seem to contradict the prolonged dominance of U.S. equities in recent years. U.S. equities have consistently outperformed international and emerging markets over the past decade, as evidenced in Chart 1, which tracks 5-year annualized returns. However, a historical perspective reveals a different pattern. In the last 40-plus years, the chart shows that new leadership emerged after economic and market shocks. For instance, international equities reigned supreme in the 1980s; however, after the early 1990s recession, U.S. equities took the lead with the dotcom boom. Following the dotcom bubble burst in the early 2000s, emerging markets surged, led by China's economic expansion and rising commodity prices. The 2008 subprime crisis initially created uncertainty in leadership, but around 2012, U.S. equities regained their dominance.
U.S. equities have led the pack for the past decade. Is a change in market leadership possible?
The chart demonstrates that major market shifts coincide with economic disruptions and tend to usher in new leaders. Despite the current era of U.S. equity strength, the cyclicality of markets suggests that change is inevitable. Aggressive central bank rate hikes may eventually trigger a recession and an equity market correction. While the timing remains uncertain, history indicates that a turning point in the business cycle is not a matter of if but when, which presumes a new leader could emerge.
Chart 1: Rolling 5 Years Annualized Returns
(Click image to enlarge)
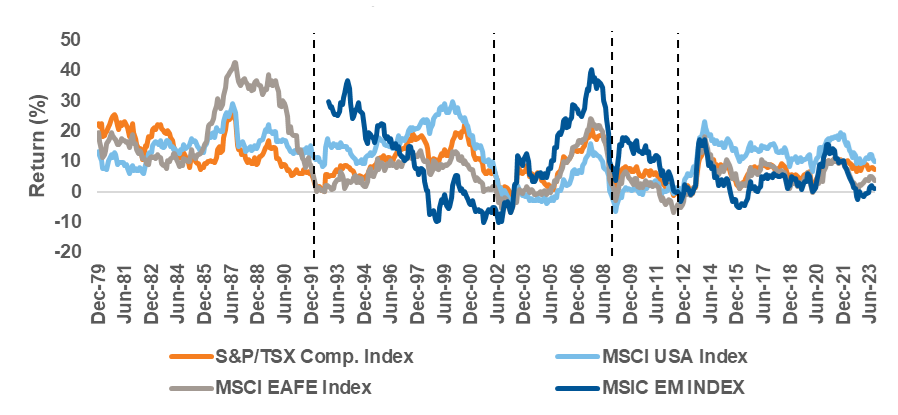
Source: LSEG DataStream, Russell Investments. As of September 30, 2023.
The conclusion, however, shouldn't be that the U.S. will necessarily underperform over the coming years. In the past few years, the equity markets in the U.S. have been dominated by a select few mega-cap technology-oriented stocks. More recently, the excitement has surrounded artificial intelligence and the magnificent-7 stocks. However, this concentrated leadership means plenty of reasonably valued stocks within U.S. equities remain.
Examining opportunities in U.S. equities outside the mega-cap space
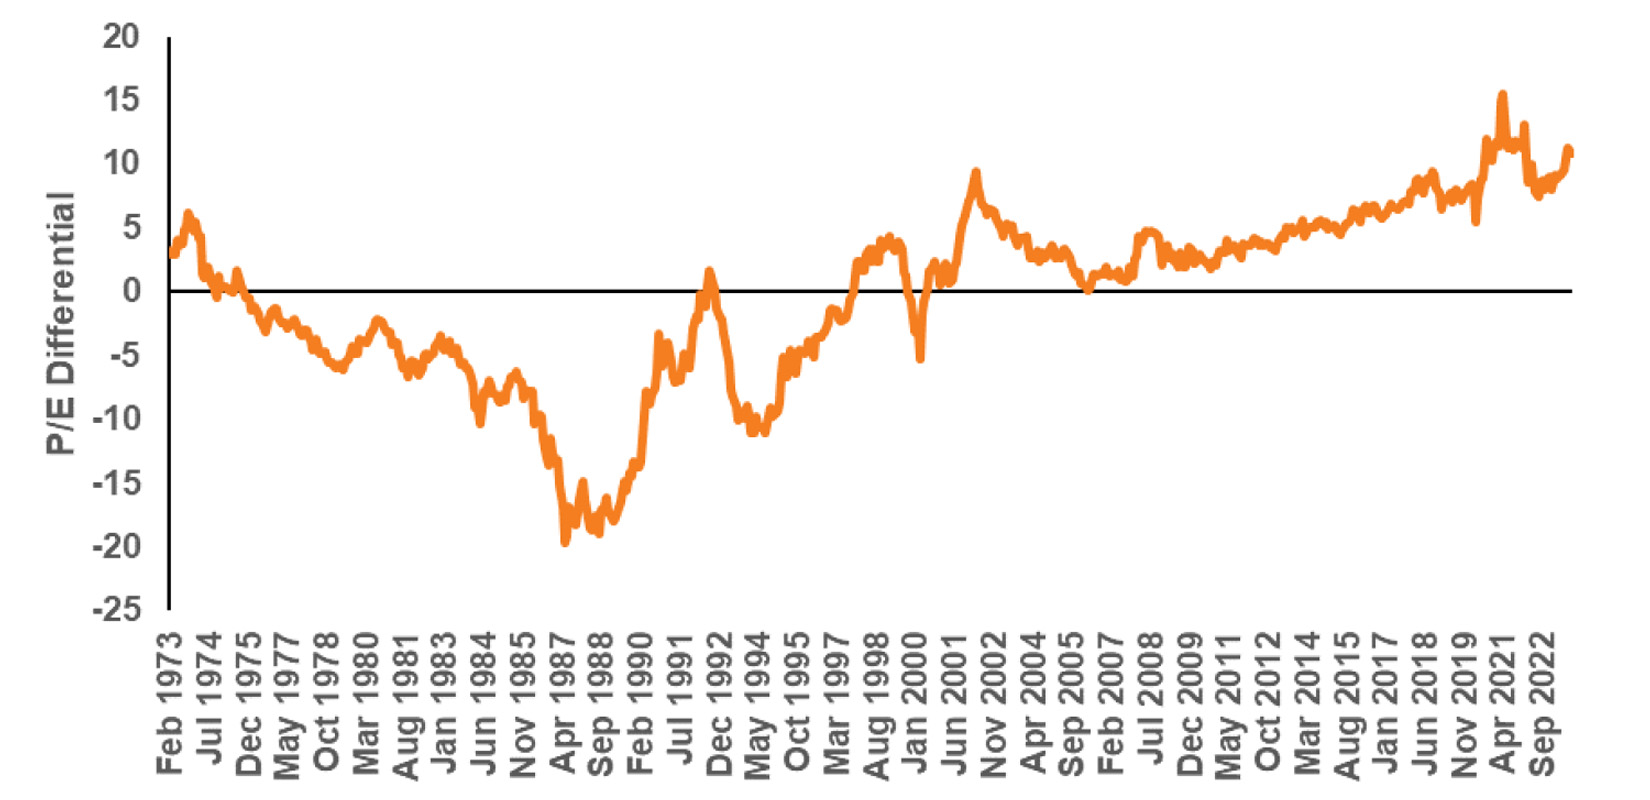
For instance, while the S&P 500 Index's forward price-to-earnings (P/E) ratio stands at 18.5—slightly above the long-term average of about 16—when we exclude the dominant mega-cap technology stocks, it drops to a more reasonable 16.5, i suggesting opportunities outside the mega-cap technology space. Additionally, dipping further down-market capitalization reveals that small-cap U.S. equities are trading at their widest discount to large-cap shares in the past decade, as Chart 2 demonstrates . Though small caps can be more volatile, and the short-term business cycle outlook remains uncertain, they hold significant untapped potential and an opportunity for superior returns relative to large-cap shares.
It's not about avoiding U.S. equities due to potential underperformance; instead, the key is to skillfully select securities within both large and small-cap U.S. equities that have the potential to outperform despite the overshadowing effect of the mega-cap tech giants.
Chart 2: Forward P/E Differential (Small Cap Less Large Cap)
(Click image to enlarge)

Source: LSEG DataStream, Russell Investments. As of September 30, 2023.
The case for investing globally
While we acknowledge that there are still investment opportunities within the United States, a compelling argument is taking shape for international shares. This perspective has been in play for quite some time. However, there has yet to be a sustainable turnaround of relative performance for international equities. Nonetheless, the valuation argument shouldn't be ignored, as illustrated in Chart 3. Notably, U.S. equities carry a higher valuation than other global regions and are most stretched relative to its history.
For instance, with a forward (P/E) ratio of 19.6 for the MSCI USA Index, U.S. equities currently trade 2.2 points higher than their 10-year median. In contrast, international equities represented by the MSCI Europe ex-UK Index, with a P/E of 13.0, are cheaper than U.S. stocks and trade 1.5 points below their historical median. It's worth considering that during the 1980s, international markets outperformed their U.S. counterparts and commanded a premium valuation. This historical fact is often overlooked in today's investment landscape, as shown in Chart 4.
Chart 3: Forward Price to Earnings Ratio
(Click image to enlarge)

Source: LSEG DataStream, Russell Investments. As of September 30, 2023.
Chart 4: P/E Ratio - U.S. Less International
(Click image to enlarge)
 Source: LSEG DataStream, Russell Investments. As of September 30, 2023.
U.S. earnings growth lagging its peers
Even more intriguing and counterintuitive is that despite the U.S. stock market's share price outperformance, its earnings growth has fallen behind many international counterparts since 2022 . Chart 5 illustrates that the 12-month forward earnings per share (EPS) growth in Europe, excluding the U.K. and the UK itself, has been more robust than that in the United States. This suggests that the premium investors are willing to pay for U.S. shares is contributing to its outperformance rather than a lack of earnings growth from its international peers.
Chart 5: Cumulative 12-Month Forward EPS Growth
(Click image to enlarge)
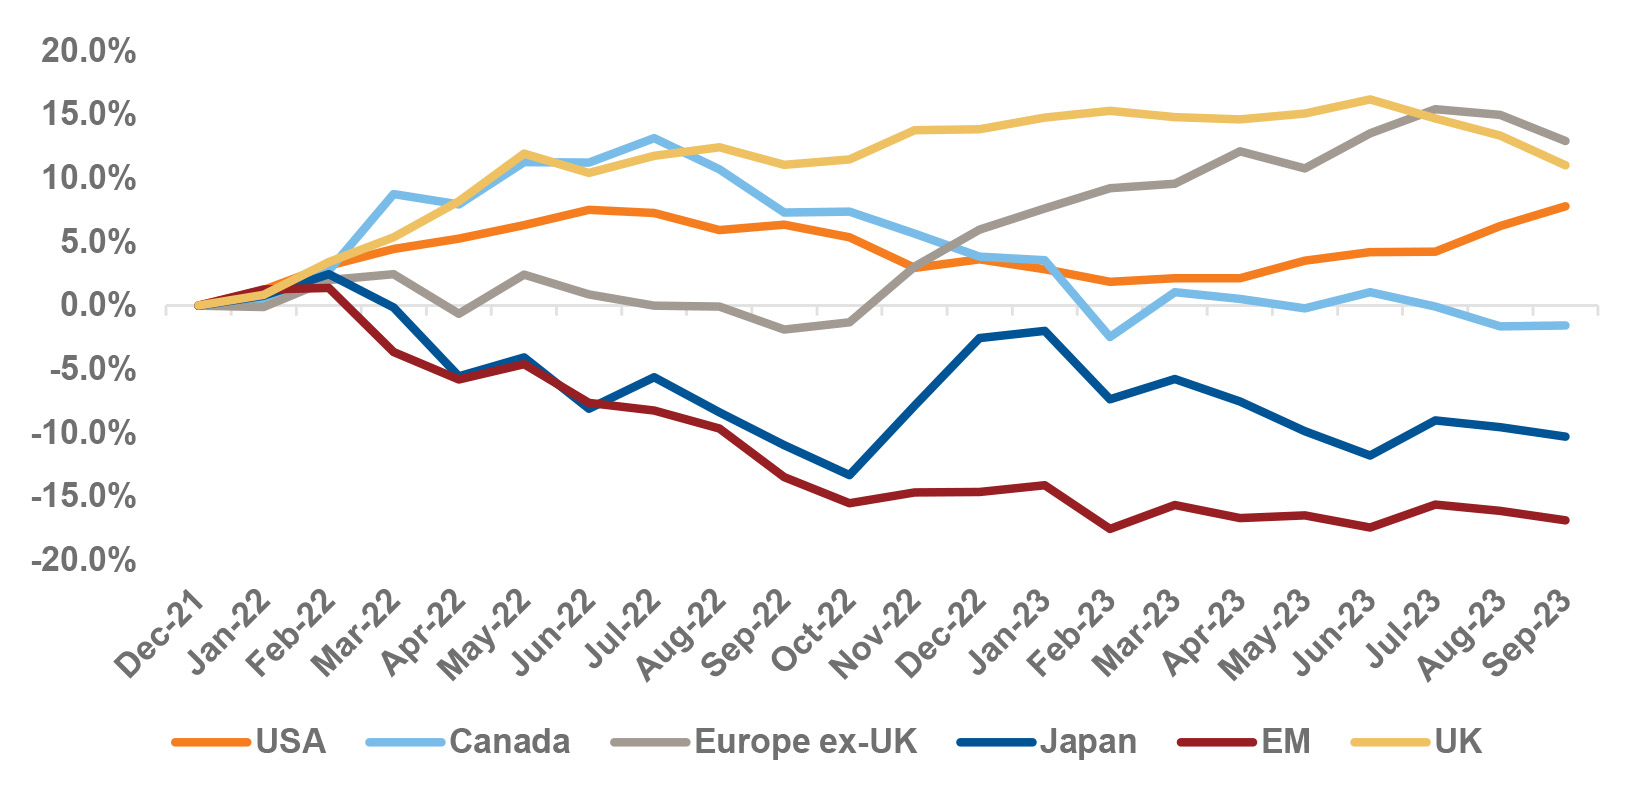
Source: LSEG DataStream, Russell Investments. As of September 30, 2023. Based on respective MSCI Indices.
What about fluctuations in the CAD?
One crucial factor to consider when venturing into international investments is currency. Unhedged investments in international securities are susceptible to fluctuations in the Canadian Dollar's value relative to other global currencies. However, an unhedged international allocation could benefit Canadian investors, potentially improving risk-adjusted returns. The Canadian dollar is considered a pro-cyclical currency, meaning its movements correspond with the global economy. When the global economy is humming, and commodities are in demand, the CAD tends to appreciate. Conversely, it tends to depreciate in a global slowdown or recession. It's this pro-cyclicality that makes the CAD a diversifying currency. For instance, when the global economy is slowing, international currencies like the USD or the EUR appreciate against the CAD, offsetting potential downside returns from international equity, while the opposite occurs when the global economy is growing. The net effect is improved risk-adjusted returns from an unhedged global allocation, as shown in Chart 6. The chart compares world equity return, risk, and risk-adjusted returns, as measured by the unhedged MSCI All Country World Index (ACWI). Unhedged MSCI ACWI in CAD terms had a better return and lower risk, resulting in a higher return per unit of risk relative to the MSCI ACWI in local currency terms. Conversely, due to the USD's counter-cyclicality, the MSCI ACWI in unhedged USD had the opposite experience. In other words, the strengthening of USD over the past decade was a headwind for U.S. investors investing internationally. However, the currency fluctuations were a diversifier for Canadian investors and enhanced the investment experience.
The takeaway for Canadian-based investors is not to obsess about short-term currency fluctuations and to stay focused on the favorable long-term tendency of potentially improved risk-adjusted returns from staying unhedged.
Chart 6: Currency Impact on risk and return
(Click image to enlarge)
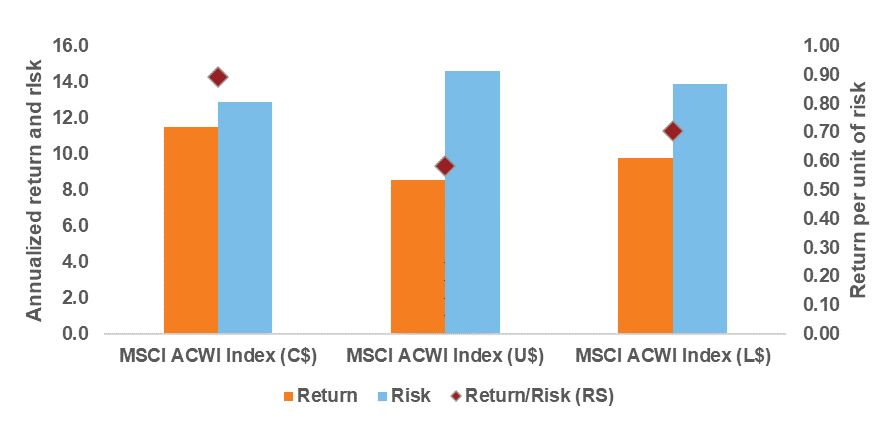
Source: LSEG DataStream, Russell Investments. As of September 30, 2023. Risk and returns are annualized based on 10 years monthly returns, unhedged. C$ = CAD, U$ = USD, L$ = Local. RS = right scale.
Key reasons to consider investing globally
In addition to the factors discussed, there are economic considerations that make international diversification compelling:
- Europe – While Europe's economy has made significant strides in advancing green technology, it remains in the early stages of this transition, demanding substantial investments. This situation creates investment opportunities for those seeking to capitalize on the evolving energy transition theme.
- Japan – Japanese equities have outperformed most regional equity markets this year, except for the tech-heavy Nasdaq in the United States. After a prolonged period of deflation, Japan's economy has shown signs of recovery, supported by corporate governance reforms and the Bank of Japan (BoJ)'s accommodative monetary policies, which have weakened the yen and boosted its manufacturing and exports. Although eventual policy normalization is expected, the BoJ is likely to tread cautiously to avoid a return to deflation. Japan's improving growth and inflation dynamics have bolstered its case for long-term investors.
- Emerging markets – The deceleration of the Chinese economy has posed challenges for the broader asset class. While currently undervalued, if substantive policy support from Chinese policymakers does arrive, it could revive their markets. On the other hand, India's robust population growth and expanding middle class make its stock market a potentially appealing destination for long-term investors, despite short-term valuation concerns. Additionally, countries like Mexico , Vietnam, Thailand, and others stand to benefit from the diversification of global supply chains. Notably, emerging markets represent a diverse and inefficient asset class, emphasizing the need for skilled security selection to unlock its full potential.
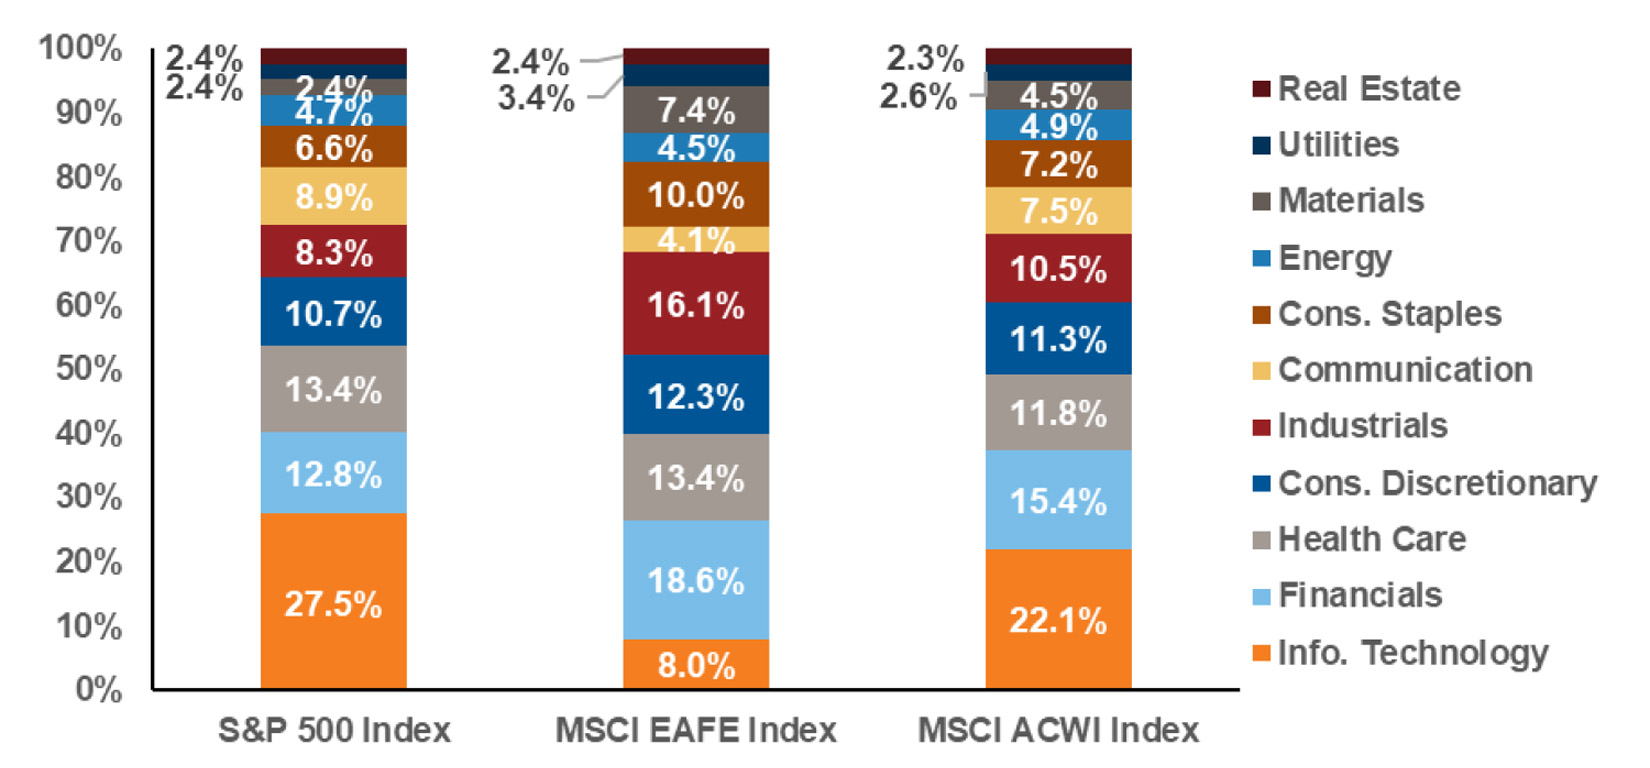
The decision to allocate your investments between the U.S. and other international markets is not a binary choice. Both have opportunities. While there are undoubtedly attractive investment opportunities in U.S. equities, it's essential to recognize that significant potential exists in other global regions. As highlighted in Chart 7, sector allocation is one key factor contributing to the differences between the U.S. and EAFE markets.
The U.S. market is heavily weighted toward technology and has significant exposure to the communications sector. A more pragmatic approach is considering a global perspective, using the MSCI All Country World Index (ACWI) to represent the global market. ACWI offers a more balanced sector allocation, and broader geographic diversification, defusing the potential overrepresentation of the U.S. equity market sectors but not entirely dismissing it. However, active management and skillful security selection are critical at this stage, not only for navigating the volatility associated with the business cycle uncertainty but also for identifying opportunities that will thrive in the years to come.
Chart 7: Sector Allocation: USA vs. International
(Click image to enlarge)
Source: S&P, MSCI, Russell Investments. As of September 30, 2023.
The bottom line
Ultimately, while the U.S. market remains a crucial part of any investment portfolio, it's wise to broaden your horizons and expand opportunities both within and outside the U.S. Embracing a global perspective is essential, as the investment landscape is ever-evolving, and change is the only constant.
i Based on Yardeni Research, Inc. report as of Sept. 29, 2023. Mega-cap technology is represented by Alphabet, Amazon, Apple, Meta, Microsoft, Netflix, Nvidia and Tesla.