The active management rebound: Spotlight on global equities
After a challenging first half of 2020 for active managers with smaller capitalization (cap) tilts and a focus on value, investors who stuck to their process have been rewarded strongly over the past six to nine months. Below, we share key drivers of the recent rebound, the experience for diverse manager styles and our views for global equity active manager selection going forward. As economies reopen, we believe that strong stock selection from multiple differentiated skilled active managers, combined with a disciplined approach to valuation, will be key to achieving success going forward.
2020: The year that challenged active managers
As the COVID–19 crisis escalated, the stay–at–home trade drove market concentration from already extreme to historic levels, as a narrow handful of the largest technology (tech) names rallied to all–time highs. The COVID–19 shock was highly unusual, as these same names led the market in both the initial downswing and the sharp upturn that followed. Given these headwinds, global equity performance overall was challenging for most of 2020. However, starting in the late summer of 2020, things began to change. The subsequent rebound in performance shows how staying disciplined through volatile markets can be rewarded.
Markets turn fast
The initial signs of style rotation occurred late in the third quarter of 2020, a pattern that gained traction after three consecutive vaccine Mondays in November – days marked by positive news about the efficacy of COVID–19 vaccine candidates. The swing in sentiment fueled some of the largest daily momentum reversals. The charts below show just how aggressively markets rotated.
Style Performance
(Click image to enlarge)
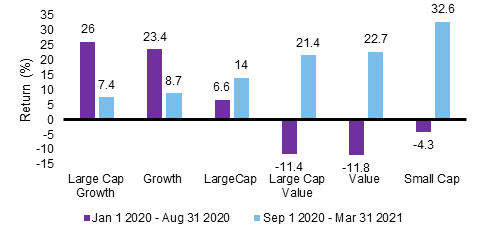
Source: MSCI and FactSet as of March 31, 2021. Gross Total Return, net dividend withholding tax, in USD. MSCI indices used, from left to right: MSCI World Large Cap Growth Index, MSCI World Growth Index, MSCI World Large Cap Index, MSCI World Large Cap Value Index, MSCI World Value Index and MSCI World Small Cap Index.
(Click image to enlarge)
Sector Performance

Source: MSCI and FactSet as of March 31, 2021. Gross Total Return, net dividend withholding tax, in USD.
We entered the new year with our proprietary cycle and valuation assessment/signals strongly supporting a tilt to value. The sentiment signal turned positive in early 2021. In our view, this rare combination of positive cycle, valuation and sentiment (CVS) represents a once–in–a–generation opportunity for valuation–conscious investors. The chart below shows the evolution of this aggregate CVS score for the value factor over time – out–stretching even the tech bubble of the late 1990s as a supportive message for value stocks.
Contribution from Cycle, Valuation & Sentiment to Aggregate Signal for Russell Investments Value Factor
(Click image to enlarge)
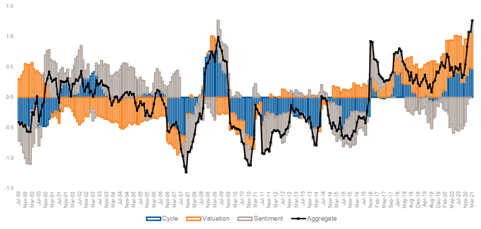
Source: Russell Investments, MSCI, FTSE, Refinitiv. July 1, 1999 to March 31, 2021
Performance trends: Discipline pays off
A multi–manager approach can provide the opportunity to remain well–diversified, with the stock–selection of managers driving outcomes, while also leaning into these indicators when they offer opportunities.
At Russell Investments, our multi–manager approach allowed us to stay in the game during a period where, for some managers, the outcomes were 10–20% behind the broad market. The turning point began around September and picked up steam in the first quarter of 2021.
Value managers experienced the most dramatic rotation, with excess returns against the broad market approaching 10% in some cases in the first quarter of 2021. Despite headwinds for growth names in 2021, our growth managers broadly outperformed their growth indices in the first months of 2021 after posting outstanding 2020 results. Part of this recent success has come from opportunities presented by the unwinding of the extremely narrow market concentration of 2020, as seen below. As market concentration has declined, stock–picking has returned to favor. We expect this to continue going forward.
Market Concentration: Improving, but remains historically high
(Click image to enlarge)
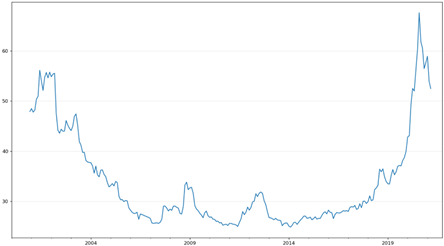
Herfindahl–Hirschman Index1as of March 31, 2020. Source: Russell Investments, FactSet, MSCI.
Our 2021 outlook
As we move into the second quarter of 2021, we believe the active management environment is looking increasingly favorable. In addition to the significant CVS tailwinds mentioned above, many of the traditional indicators for active managers are flashing positive as well. Cross–sectional stock volatility remains high and stock versus stock correlations are falling. Market concentration indicators remain historically untenable and should continue to fall (see market concentration exhibit above). We believe these trends should accelerate as vaccines continue to be distributed and economies begin to reopen.
Remaining humble – risks to manage in 2021
While we believe that positioning should be supported by the broad market outlook, there are scenarios that could be problematic. A sharp return of the stay–at–home trade due to virus variants, coupled with a lack of vaccine efficacy, remains a watchpoint. Risk complacency in the markets is concerning, i.e., the euphoria around meme stocks, Bitcoin and non–fungible tokens. An unexpected rise in geopolitical tensions causing a flight to safety is always a risk. However, remaining broadly diversified can be less volatile than single manager alternatives.
There is still time to hop on board
Markets move fast and the 2020–2021 period has seen some of the most dramatic rotations in history. At Russell Investments, staying committed to our preferences for skilled stock picking, smaller cap exposures and valuation discipline – while simultaneously mitigating risks – has paid off during this timeframe. If history is any guide, these broader active management rotations can extend for long periods of time, especially when reverting from such extreme starting points. Our view is that there is still plenty of time for investors to benefit from the active management opportunities in a truly open architecture set of global and regional active managers.
1 The Herfindahl-Hirschman Index (HHI) is a commonly accepted measure of market concentration. It is calculated by squaring the market share of each firm competing in a market and then summing the resulting numbers. It can range from close to zero to 10,000.