What if the next bounce falls short?
Key strategies to consider to reduce equity drawdown risk in volatile times.
Until early 2018, the market had been behaving in a consistent pattern for several years. Corrections were short-lived, as were spikes in implied volatility—as measured by the CBOE Volatility Index (the VIX)—from otherwise suppressed levels. While the correction in Q4 2018 was longer-lived, we have already bounced back from this drawdown, with the promise of prolonged monetary accommodation by the U.S. Federal Reserve (the Fed).
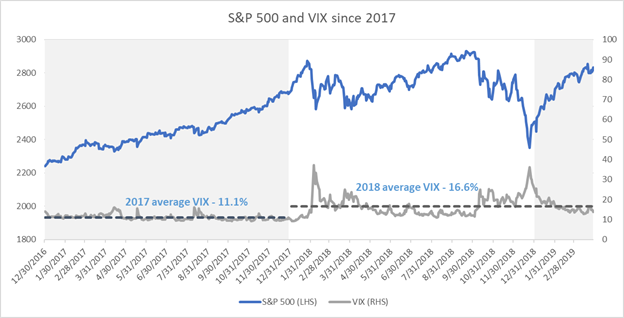
Source: Russell Investments & Bloomberg
Despite the recent rebound, 2018 was different than 2017, and arguably a more normal year in terms of average market volatility. The volatility spike in early 2018, however, was anything but ordinary. It was not the peak level of the VIX that was notable. It was the near-record low starting point heading into the shock. The extremity of that spike can also be seen in the CBOE VIX Volatility Index (the VVIX), which measures the volatility of the volatility index.
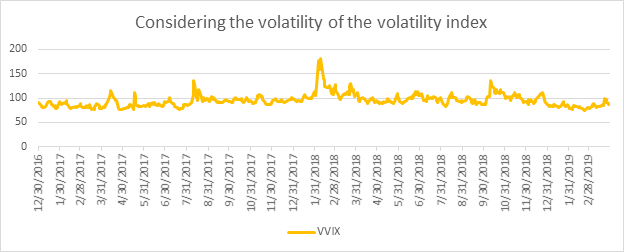
Source: Russell Investments & Bloomberg
While the fourth quarter of 2018 did not have the same relative increase in volatility, it did involve a greater percentage drop in the underlying index and came closer to a point of capitulation before the markets rebounded. Ultimately, it is the depth of a market drawdown (and the time required for recovery) that should matter most to an institutional investor that needs to support ongoing cashflows. Thus far in 2019, the market environment has been more similar to that of 2018 than 2017, and concern over a more lasting drawdown should remain elevated.
Hedging, governance challenges and suitability considerations
Portfolio governance can often prevent or discourage decisions that may reduce expected return or solutions that incur incremental cost, like the premium on a put option. In many cases, investors are far enough from critical funding levels to maintain a longer investment horizon and weather a potential storm the traditional way. Others have a strong sponsor with the flexibility to increase contributions in the event of a downturn.
But what if neither of those fit your case? Structure and accountability of the investment staff often impacts who might sponsor this idea. And three questions should be considered:
1. Have you adopted a total-plan risk framework for managing the investment portfolio?
We have seen an increasing interest in an aggregated risk view at the total-portfolio level. Clearly, this is the most holistic way to consider risk, as interaction effects across conventional asset class silos can be material. Why explicitly hedge something that might be diversified elsewhere in the portfolio? While a total-portfolio approach is a longer-term direction that most institutions are heading toward, the next recession may hit before such a framework is implemented.
Are you or your investment governing body open to the possibility that benchmark risk is best quantified as risk of drawdown rather than standard deviation of returns? Long-term damage is caused by a decline in portfolio value, particularly when spending needs don’t subside over that troubled period. We consider the Calmar ratio a better measure of undue risk to the downside.
Calmar ratio = Expected annualised return / Max drawdown
A risk-adjusted return framework can be applied, using drawdown potential as the key measure of risk. In an environment with suppressed equity return expectations, this approach can positively skew an investor’s return expectations. For some investors, a modest reduction in mean-expected return may be well worth the improvement, in the event of a particularly bad path that could lie ahead.
2. Is there a person accountable for absolute drawdown risk in your current investment management team?
This is part of the role for an asset allocation specialist or for an investment-risk-management function, but not all institutions have a clear role like this reporting into the CIO. Further, many in this role do not have an account structure ready to holistically implement hedges. As a result, if accountability does not flow via performance measurement, it is hard to claim that someone owns this trade—or the absence of it, as is more likely the case.
3. Without a total-portfolio risk-offset account, can you reduce drawdown risk in the larger, more volatile public equity allocation?
In order to apply hedges to this subset of the total portfolio, it is critical to address the alignment of goals of an institution’s equity team. If the team is judged on generating excess return, one way to keep their focus on that return is to add defensive components to their overall benchmark. This can help alleviate any concerns for running modestly lower risk/return characteristics for prolonged periods. Remember that this is the purpose of drawdown risk mitigation. Targeting an improvement to the Calmar ratio on the public-equity composite could also incent more drawdown-aware behaviours.
If we decided to reduce equity drawdown risk, what might we do?
Tactically hedge with options. While committee action is often required to hedge a portfolio with options, here are some considerations to fit hedges into that more deliberate decision-making structure:
1. Shorter-dated options and cross-asset hedges can challenge governance.
A higher level of discretion and expertise is required to succeed here. Even those with existing investment discretion to hedge may want to consider a more deliberate approach with less potential for regret in the event that hedge timing is not perfect.
2. Use longer tenor option structures for a slower-twitch response.
- This approach can be much more forgiving on timing of entry and exit and help to create a wider window for success.
- One-year option structures are less responsive than quarterly structures, but we believe this is a good trade-off. Time-decay, the biggest cost of option hedging, occurs at a slower rate with longer-tenor options. While tenors longer than one year are not uncommon, the reduced responsiveness of the hedge is often counterintuitive to staff if a correction does hit early in the protection term. We would suggest these only in a case of collaring expected returns over these longer horizons—this may often be an attractive means for well-funded portfolios to generate return without the risk of falling below key funded levels.
- Consider staging into a series of longer tenor options to diversify the maturities, the entry and exit points, and the timing decisions for closing or rolling the position.
3. Choose hedge structure.
In the charts below, we illustrate the potential impact of rolling one-year put options (as well as put-spreads designed to reduce the cost). Pricing shown as of end of March specific to the S&P 500® Index.
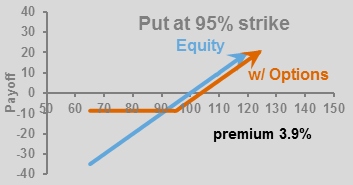
Source: Russell Investments. Option pricing indicative as of March 31, 2019
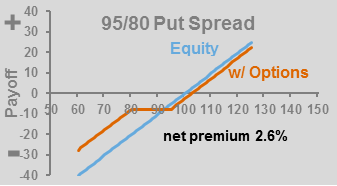
Source: Russell Investments. Option pricing indicative as of March 31, 2019
Looking at a hedging period starting one year before the last recession and extending two years beyond the start, here is how such option hedges behaved relative to the underlying market.
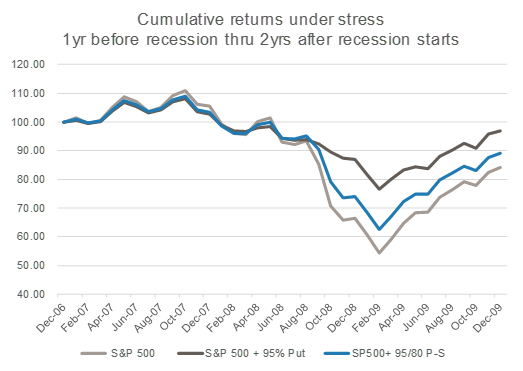
Source: Russell Investments & Bloomberg
When do you hedge? We believe investors should look at more than one past recession to gauge how far ahead of a recession the market peaks. The key is looking ahead about a year and estimating the probability of reaching a recession. Russell Investments’ strategists perform this type of analysis. Our forecast for the start of a recession has been pushing out since the U.S. Federal Reserve (the Fed) went on hold with rate hikes, but as of the date of this publication, the probability is already at caution levels.
Put or put-spread? Clearly the put is designed to provide more protection, but it may cost investors more if they are wrong. If we return to suppressed volatility levels, we would argue for the put, since an investor could always turn it into a put-spread after the first leg down in a correction. At that time, investors can set the strike lower and receive more premium by selling a put, once volatility is elevated.
When do you take the hedge off? This is the most important question. As the graph above shows, there is a relatively long window where an investor can unwind the hedge after it has helped the cause. This could allow for a more formal governance process to approve the removal of the hedge; however, goals for success should be defined at time of the initial hedge trade, with advance approval to close the hedge under certain criteria.
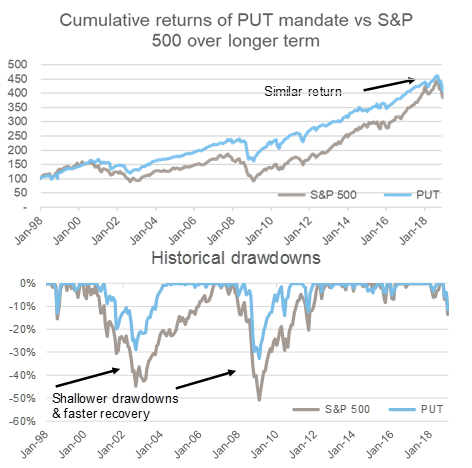
Replace equity exposure with more defensive varieties. Our preference here is to take advantage of selling options to generate income rather than adding hedges that decay more in value the longer an investor keeps them. One of the more popular strategies mimics the CBOE PutWrite Index (ticker PUT). This is designed to generate an equity-like return pattern from the combination of enhanced cash holdings and monthly short put options struck at the money. It may sound counterintuitive that taking on downside risk to the market without upside potential could generate returns; however, harvesting the monthly premiums can provide a considerable offset to downside equity risk. The strategy also benefits when some of the options sold ultimately expire worthless.
Source: Russell Investments & Bloomberg
How do I get this in my portfolio? We believe investors should hire managers that can outperform the PUT index with a more diversified, active strategy. Think of this as the beta or benchmark that makes sense over long periods of time, since it is diversifying equity risk premium with a return premium generated from selling implied volatility via the options markets.
When is the best time to add this exposure? We believe that late in the business cycle, this strategy starts to outperform underlying equity. If held throughout a full business cycle, we believe it generally delivers about 90% of the return with about 70% of the volatility. As you can see, it also can reduce depths and lengths of drawdowns when the market does correct. The beauty of this strategy is that it is designed to not require precise tactical timing and is designed to potentially be held well beyond the exit from the pending recession.
Is PutWrite (PUT) better than a one-year tactical hedge with options? The longer the period you look at, we believe the more the answer becomes YES. Option protection is a tactical solution that may help in the most challenging of times, but its success requires timing calls. We believe these hedges should be in place when truly needed, but some investors may have difficulty in making those calls and may find a more strategic solution like PUT easier to manage. We believe using option protection over the long term may be too costly, but the following table gives an idea of the kind or return drag that would have resulted from doing so in comparison to PUT.
| Summary Statistic | S&P 500 | PUT | S&P + 95% Put | S&P + 95/80 P-S |
|---|---|---|---|---|
| Ann Return | 6.61% | 6.94% | 4.15% | 5.66% |
| Ann StDEV | 14.9% | 10.8% | 9.5% | 11.8% |
| Sharpe Ratio | 0.28 | 0.42 | 0.18 | 0.27 |
| Worst Drawdown | -50.9% | -32.7% | -29.3% | -42.5% |
| Calmar Ratio | 0.13 | 0.21 | 0.14 | 0.13 |
| Correlation to S&P 500 | 100.0% | 84.5% | 91.9% | 98.5% |
Source: Russell Investments & Bloomberg. Date range: Dec. 31, 1997-Dec. 31,2018
Holding ongoing exposure to PUT in lieu of a portion of the equity allocation is a sound strategy, and can even result in better drawdown improvement during multi-year corrections (like the early 2000s and 2008) than one-year option-based hedges (which must be rolled at high cost when the market is still correcting).