Repurposing a passive allocation with a completion portfolio
As soon as an asset owner allocates capital to more than one manager, an interaction effect exists which will have an impact on the investor’s overall portfolio outcome. What unintended risks result from the combination? What desired exposures are not covered? How does an investor manage these? These are all important questions to be addressed when managing a total portfolio outcome. Unfortunately, for the asset owner, the individual managers are not able to do this on their own.
Why? By design, money managers are not privy to each other’s holdings. They are focused on delivering excess returns using their specific area of investment expertise. Because of this, their unique investment insights are reflected in their respective account within the overall portfolio. But there’s a drawback to this so-called agency problem: unintended risks may emerge in the overall portfolio, due to the interactive effect between managers. Simply put, the combined positions of all managers may result in a bias toward a particular risk overall, related to sector, region or factor. These risks may not be fully aligned with the investor’s preferred positioning, based on long- and short-term investment opportunities and desired risk allocations.
So, what’s the investor to do? How can these unintended risks and biases be removed so that the overall portfolio is aligned the way the investor wants it to be?
Enter completion portfolios.
Completion portfolios: The right tool for the job
We believe that completion portfolios are a powerful tool for an investor allocating to multiple manager strategies. This is because the explicit role of these portfolios is to complement the existing managers and align the total portfolio with desired risks and exposure. The completion portfolio can manage that interaction effect, with its objectives being three-fold:
- Preserve and enhance unique investment insights from active managers, largely driven by security selection
- Manage composite level risks and exposures to desired levels
- Enhance returns incrementally, as compared to using a passive alternative allocation
How the interaction effect leads to unintended risks
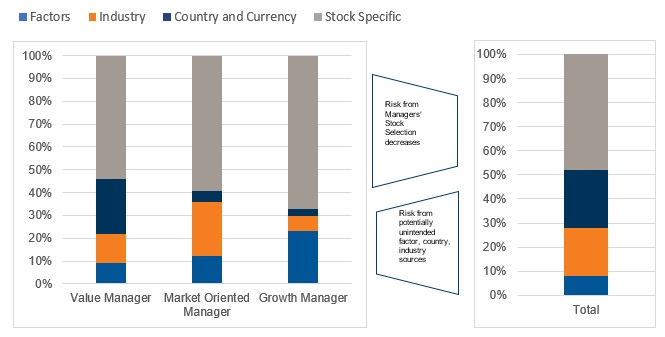
Unintended risks can come in different forms, from biases toward certain regions or sectors to biases in factor risks and risk budgeting challenges. In a prior Russell Investments blog, we explored risk biases in more detail and similarly walked through examples on how to manage around them. As an example of how manager interaction effects can materialize into unintended risks, below is an example of a simple three-manager structure. In this example, we use managers from Russell Investments’ global equity portfolios and observe how risks in a composite portfolio differ from risk within the individual manager strategies. Often with the interaction effect, common factor biases can outweigh the higher conviction and repeatable sources of alpha expected through manager’s stock selection. So while risks like these are obviously unintended, they’re also very real.
Figure 1: Active risk decomposition example, 3 active managers & composite
Market volatility can exacerbate risks
Having investment tools to control unintended risks become especially relevant in times of market stress and rotation. To extend this example, let’s consider the investment choices and market conditions a global investor would’ve been faced with in December 2019, when market volatility was mild and the COVID-19 pandemic had yet to unravel in global economies and markets. In this example, we’ll use allocations to four managers which are high-conviction active strategies that we commonly use within our own investment program. Since an active/passive allocation is typical in investment programs, in this initial composite we’ve assigned 85% of the capital to the active managers, with the other 15% allocated to passive.
The first thing that jumps out here is that stock selection is driving around half of the active risk budget, with approximately 35% of active risk coming from factor and region biases.
Figure 2: Active risk, decomposed by source contribution
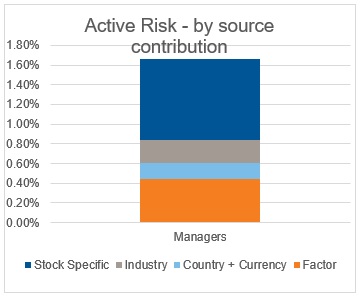
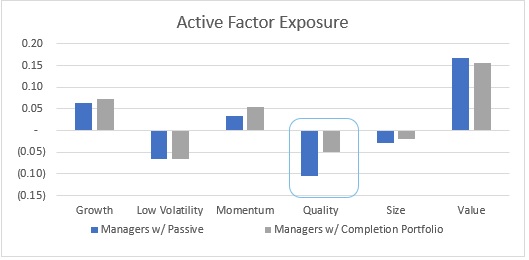
Figure 3: Active factor exposures in manager composite

As we consider the approximately 50 basis points (bps) of tracking error in the composite portfolio driven by factor exposures, we can identify which active factor exposures are driving this risk and make deliberate decisions around how much each factor is contributing to risk. From our vantage point, this is precisely where completion portfolios become a powerful tool for an asset owner, enabling conviction in alpha expectations to drive manager allocations and leveraging a flexible completion portfolio to manage top-down and bottom-up risk exposures in the composite.
The value of defining factor risk preferences
We believe that establishing a strategic preference around factor risks is a key element for owning risks and better managing total portfolio outcomes. We see this coming generally in one of two forms with asset owners:
- Preferring positive exposure to strategic factors, with an expectation of performance enhancement over a full cycle
- Preferring to be closer to factor neutral on a strategic basis, minimizing factor exposures’ contribution to overall risk
Both views on strategic positioning will benefit from the use of completion portfolios in managing unintended exposures found with allocations to active managers alone.
Case study: Repurposing passive with a completion portfolio
In the following case study, let’s consider repurposing the 15% passive allocation in a more intentional way, using a completion portfolio. We’ll do this by starting from strategic allocations and dynamically adjusting factor weights to best complement existing exposures within each active manager’s portfolio.
First, we start with allocations in our strategic portfolio, which is designed to capture factor return premia over the full market cycle. Our strategic portfolio is a weighted allocation to four strategic factor portfolios: 40% value, 30% momentum, 20% quality and 10% low volatility. Next, we’ll consider factor exposures already present in the managers’ portfolios and adjust accordingly. In this case, there is already a meaningful exposure to the value factor and a modest momentum factor exposure, while quality and low volatility exposures are underweight. For this completion portfolio, we’ll increase the quality and low volatility allocations while correspondingly reducing the value and momentum exposures.
Figure 4: Factor allocations within example completion portfolios
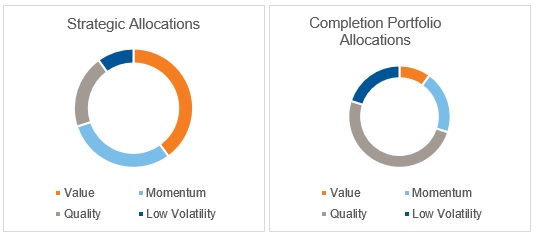
Table 1: Allocations within total portfolio examples
Allocations |
Managers w/ passive | Managers w/ completion portfolio |
| Active composite (4 managers) | 85% | 85% |
| Passive index | 15% | |
| Completion portfolio | 15% |
In figure 5, we see how repurposing passive allocations into a completion portfolio helps manage factor risks in the overall portfolio more in line with strategic preferences. Notably, the underweight to quality is reduced nearly in half in the overall composite
Figure 5: Active factor exposures in various total portfolio illustrations
By using a completion portfolio, the fundamental expectation is that risks within the total portfolio will be better aligned with return expectations, while unintended or uncompensated risks are mitigated. With the total portfolios illustrated above, we can simulate how risks and returns would’ve been realized during the 12 months between Dec. 1, 2019 and Dec. 1, 2020—a period of extreme market volatility.
In Figure 6, we see the cumulative excess returns of these portfolios. With the inclusion of a completion portfolio, we can see the active drawdowns in the first half of 2020 were reduced, largely driven by tighter factor risk management.
Figure 6: Cumulative excess return, Dec 2019 to Dec 2020
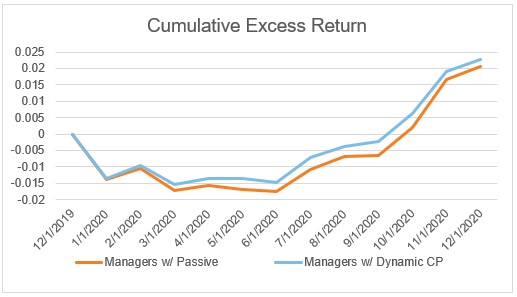
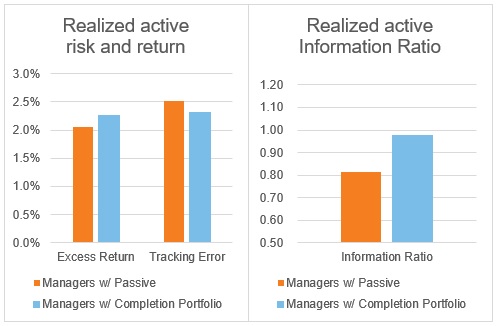
Table 2: Realized active risk, active return and information ratio. Dec 2019 - Dec 2020, annualized.
In this simplified example of using active manager allocations along with a completion portfolio, it’s evident how asset owners can take more control of risks within a total portfolio and have more flexibility in their portfolio design to respond to changing conditions. While market conditions throughout 2020 were quite unique—and most investors would certainly have been pleased with the risk adjusted returns represented above—looking forward, it’s as important as ever for asset owners to have the right tools to own risks and investment outcomes within their portfolios.
We’ve seen recently how quickly market conditions can change and how seemingly benign risks can quickly become the most important drivers of active return. For instance, in just the past 24 months, we’ve seen the relative valuation spreads of growth vs. value stocks hit record levels, an energy drawdown of nearly 60% and small cap stocks outperform large cap stocks by over 25% in just two quarters. These are just several examples of returns from risk factors that are not easily managed through allocations to active managers alone.
The bottom line
As investors consider their current portfolios and how well they align with their investment objectives in today’s market environment, we believe that completion portfolios can be an important tool in the tool kit. This is especially true when keeping in mind a few basic points:
- Expect active managers to drive excess return through uncorrelated alpha sources
- Manager allocations are driven by conviction first and foremost
- Aggregate risks are managed holistically in a total portfolio
We believe that a completion portfolio will help asset owners ensure aggregate risks are managed holistically, while ultimately allowing active manager allocation decisions to be more aligned with the desired return convictions of the asset owner.