Retirement Income Buyer’s Guide for DC Plans
A brief history of DC
Historically, defined benefit (DB) plans were the most dominant form of retirement savings vehicles. After years of dedicated work for an employer, employees would be rewarded with a pre-agreed monthly income throughout their retirement. As defined contribution (DC) plans have replaced DB as the primary source of retirement income, the responsibility of retirement funding has shifted away from well-resourced plan sponsors to individual participants. Unlike a DB plan with a specified benefit, DC plans require the individual to determine the appropriate contribution rate, so, when combined with investment earnings, they will have sufficient assets to replace their pre-retirement income. However, the transition to decumulation introduces a new set of economic challenges, as participants are required to balance a number of interrelated risks to ensure that their savings will last through retirement.
While DC plans are both popular and predominant, they have not yet proven to be successful as measured by the DB yardstick of providing employees with a lifetime of sustainable income. The primary focus for DC plan sponsors and committees has historically been on helping participants accumulate assets during their working years, with little support provided in retirement. A common analogy is taking an airplane flight only to have the pilot parachute out of the plane just before reaching the destination, leaving passengers to maneuver the landing on their own. The landing gear of our DC system is the strategies designed to help participants convert their accumulated retirement balances into a reliable stream of income. Without this support, the vast majority of today’s retirees in the U.S. will rely on Social Security as their primary retirement benefit and only source of guaranteed income.
Exhibit 1: Five systemic forces behind the need for lifetime income solutions
Click image to enlarge
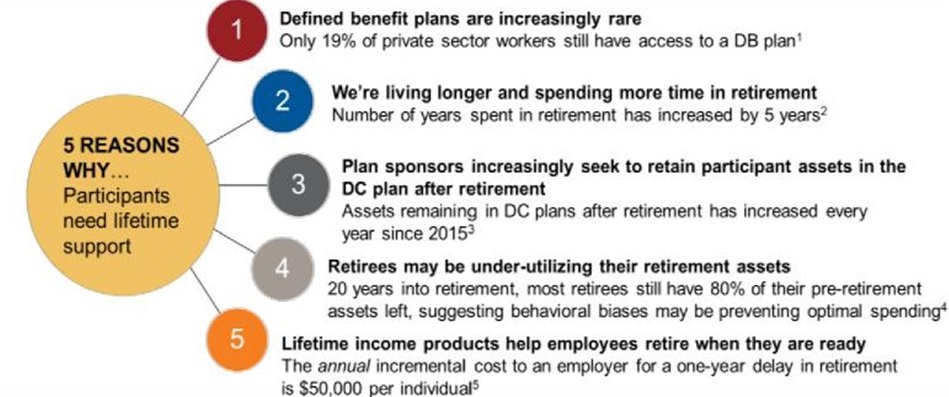
Source: 1. Employee Benefits Research Institute (EBRI) Databook; 2. Since 1940 life expectancy of those who reach 65 has increased by five years. Social Security Administration – Life Expectancy for
Social Security ttps://www.ssa.gov/history/lifeexpect.html; 3. T. Rowe Price. Percent of DC assets remaining in defined contribution (DC) plans 1 year after separating from service: 4. Spending retirement assets...or not? BlackRock Retirement Institute; 5. Prudential Insurance Company, “Why Employers Should Care About the Cost of Delayed Retirements.” SECURE Act and retirement income
SECURE Act and retirement income
The SECURE Act provided a new fiduciary safe harbor for selecting an insurance provider as a distribution option. Combined with greater product availability, the SECURE Act appears to be a catalyst, and more committees are now expressing interest in evaluating retirement income solutions for their DC plans, including several large plans that are in various stages of implementing strategies. Russell Investments expects this trend to continue. Going forward we estimate that the majority of plan sponsors will eventually include a retirement income option in their defined contribution plan
Acknowledging the capacity of plan fiduciaries to select and monitor investment options is limited. Balancing participant choice with plan menu simplicity is key to avoiding unnecessary complexity for the participant and investment committee alike. With so many options available in the marketplace, how might an investment committee choose a retirement income product that is best suited for their plan? To assist our clients, Russell Investments models the expected outcomes from different product types—based on company-specific demographics and plan-income replacement objectives—to facilitate a comprehensive evaluation of suitable products and eventually manager options. That type of detailed analysis isn’t feasible in this context, so we have created a retirement income buyer’s guide—a broader framework to help plan sponsors become familiar with the retirement income offerings that are available in the marketplace to better understand the strengths and weaknesses of each.
Do we pick a winner? No. Instead, we lay out what we believe are the strengths and weaknesses of the offerings, and leave it to investment committees to interpret the data, based on their specific, unique needs. So then, keep your needs in mind as you take a look at this, our first annual Retirement Income Buyer’s Guide for DC Plans.
Click image to enlarge

The bottom line
When it comes to picking the right retirement income offering for your DC plan, we think the chart speaks for itself. There are clearly some offerings with more positive rankings across the board. But that still may not mean they’re the best option for your plan, as the criteria will have different weightings for each firm. Our real recommendation? Ask for an in-depth analysis that models the expected outcomes from the different product types—based on your unique needs.
Criteria
Eligibility as a Qualified Default Investment Alternative (QDIA)
The first evaluation criteria focuses on each strategy’s QDIA eligibility. Following the passage of the Pension Protection Act in 2006, the U.S. Department of Labor (DOL) issued regulation that outlined four types of QDIAs:
- A product with a mix of investments that takes into account the individual’s age or retirement date (i.e. a life-cycle or targeted-retirement-date fund)
- An investment service that allocates contributions among existing plan options to provide an asset mix that takes into account the individual’s age or retirement date (i.e. a professionally-managed account)
- A product with a mix of investments that takes into account the characteristics of the group of employees as a whole, rather than each individual (i.e. a balanced fund)
- A capital preservation product for only the first 120 days of participation (an option for plan sponsors wishing to simplify administration if workers opt-out of participation before incurring an additional tax)
Using a thumbs-up/thumbs down icon, we have indicated whether a product meets one or more of the DOL’s stated definition of a QDIA.
Captures Market Upside
The second criteria evaluates the extent to which a product is expected to participate in an appreciating capital market environment. Using long-term return expectations, products with higher return-seeking allocations (i.e. greater exposure to equity and/or credit spread beta plus additional risk premia) capture more market upside, while products with lower return-seeking allocations capture less market upside. A score of 4 indicates that a product is expected to have the highest market upside capture, while a score of 1 indicates that a product is expected to have the lowest market upside capture.
Investment Risk
Investment risks can take many forms. The primary risk for equities is asset price volatility. The primary risks for fixed income are price decline due to interest rate movement, loss of principal due to downgrade or default and asset price volatility prior to maturity. The primary risk for insurance products is counterparty risk and a product with multiple insurance providers is expected to carry less counter-party risk than a single insurance provider. These are just a few.
We considered the risks associated with each product’s asset allocation and assessed the likelihood that the product would experience financial losses relative to the expected return on its invested assets. A score of 4 indicates that a product has the highest investment risk, while a score of 1 indicates that a product has the lowest investment risk.
Guaranteed Income
The fourth evaluation criteria focuses on a product’s ability to convert a participant’s asset base into guaranteed income. Here we define a product’s “ability” as: 1) the portion of a participant’s asset base that can be insured and 2) the optionality of the insurance contract. Products with a greater portion of the asset base automatically insured were deemed to provide more guaranteed income than products with less of the asset base insured, or products that only provide an option to insure. Accordingly, a score of 4 indicates that the entire asset based is automatically insured to provide guaranteed income, while a score of 1 indicates that none of the asset base is insured to provided guaranteed income.
Stable / Consistent Income
A product’s ability to generate stable and consistent income is a hallmark of retirement income products. Income may be fixed or it may vary as income and price appreciation of a portfolio vary over time. In general, fixed income products are expected to deliver more stable income than equity investments when the payout is calibrated to the fund’s investment performance. Income is considered more consistent if participants receive automatic distributions and less consistent if participants are required to generate their own withdrawals. A score of indicates that the product delivers the most stable and consistent income, while a score of 1 indicates that a product delivers the least stable and consistent income.
Longevity Protection
Longevity risk is the risk that a participant outlives his or her investment assets. Products may be designed to provide longevity protection via an insurance contract or a larger allocation to return-seeking assets through retirement, or a combination thereof. A score of 4 indicates that a product provides the most protection against longevity risk, while a score of 1 indicates that a product provides the least protection.
Explicit Costs
This criterion focuses the total cost of each product, including investment management fees and insurance costs, if applicable. A score of 4 indicates that a product has the lowest cost, while a score of 1 indicates that a product has the highest cost.
Liquidity (Access to Capital without Penalty)
This criterion focuses on product liquidity, using a two-pronged approach. First, the liquidity of a product was evaluated based on its underlying asset allocation. Second, we considered whether a participant would be penalized for withdrawing an amount from his or her investment portfolio. A score of 4 indicates that a product is the most liquid (i.e. all daily liquid holdings and no withdrawal penalty), while a score of 1 indicates that a product is the least liquid (i.e. not daily liquid and imposes a withdrawal penalty).
Complexity
The final criterion focuses on product complexity as defined by: 1) the number of decisions that a participant must make and 2) ongoing participant communication needs. A score of 4 indicates that a product requires no participant action and defaults the participant into an asset allocation at enrollment and again at – or near – retirement. A score of 1 indicates that the product does not have a default and the participant makes all investment decisions.