Tax drag: Seeing is believing
We’ve spent the better part of the last 10+ years talking about the serious headwinds that taxes have on investor returns. It’s one thing to conceptually understand why taxes can reduce investment returns, but it’s a completely different thing to actually see how big this impact can be.
Seeing is believing
When evaluating investment options, investors typically look at pre-tax returns, net expense ratios, fund size, active share, portfolio turnover and similar statistics.
But taxable investors tend to overlook the figures that have as big or bigger impact: the amount of return surrendered to taxes and the actual after-tax returns. The return lost to taxes is often a higher number than the stated expense ratio. You could say that it serves as an additional fund expense for the benefit of Uncle Sam.
A tool for enhanced visibility
To help investors see this tax impact, we offer our Tax Impact Comparison Tool. It helps you show your clients the magnitude of this hidden expense ratio. We work with and educate many advisors on how to incorporate the magnitude of tax drag in their conversations with both clients and prospects. Making it easier to evaluate the benefits of tax-managed investing can help these discussions be more compelling.
Discovery and insights across investment products & categories
Our online tool is intended as a resource to help advisors and their clients make informed decisions about the tax-impact of different investments.
By way of example, looking broadly at U.S. equity products (active, passive, ETFs), the average product surrendered 2% of its pre-tax return to taxes for the three years ending September 2022 according to Morningstar* Since this is an average, some investment products lose a materially higher amount and some lose less.
The tool gives you the ability to compare thousands of mutual funds, ETFs and Morningstar categories so that you can better determine the tax implications between products and categories.
How to use the Tax Impact Comparison Tool in 3 easy steps
- Step 1: Start by accessing the tool here or from any of our tax-managed mutual fund pages
- Step 2: Select a Russell Investments Fund
- Step 3: Then add a mutual fund, ETF and/or Morningstar peer universe category to compare
Two presentation options are available
The tool enables you to easily select two different views so you can look at both return lost to taxes and tax-adjusted returns or pre-tax returns.
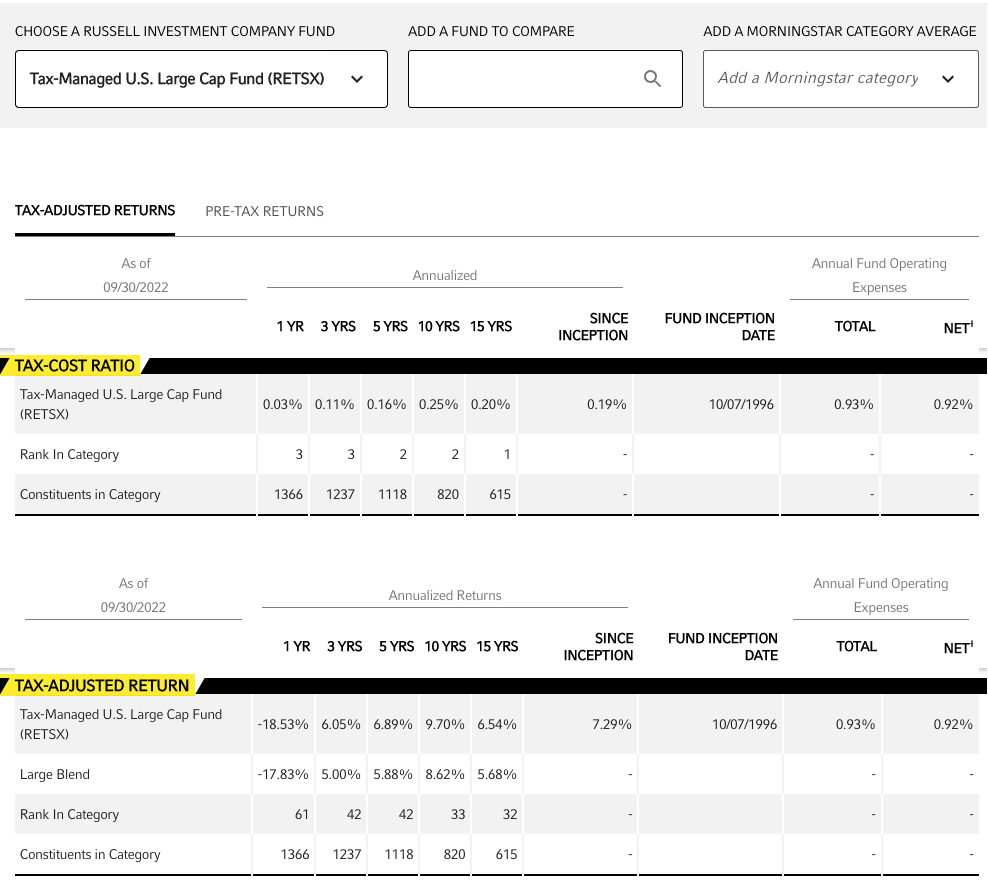
1. Tax-adjusted returns:
Click image to enlarge
Note: For illustrative purposes only. Performance information is historical and does not guarantee future results. Investment return and principal value of an investment will fluctuate so that an investor's shares, when redeemed, may be worth more or less than their original cost. Current performance may be lower or higher than the performance data quoted.
- Tax-Cost Ratio / return lost to taxes:
- This hard-to-find number from Morningstar shows how much return is lost to taxes or the “hidden” expense ratio. Like all expenses, lower is better.
- Note the % Rank in Category. How did the product compare to peers in reducing tax drag? Again, lower is better.
- Tax-Adjusted Return shows the pre-liquidation after-tax return for selected products. These returns are oftentimes difficult to find elsewhere. We’ve brought these front and center for your review and show returns after accounting for paying relevant federal taxes on any income (dividends, interest) and capital gain distributions during the period. The calculation follows the official SEC methodology.
- Also note the % Rank in Category. Many funds will move up (or down) in their universe when taxes are taken into consideration.
2. Pre-tax returns:
Click image to enlarge

Note: For illustrative purposes only. Performance information is historical and does not guarantee future results. Investment return and principal value of an investment will fluctuate so that an investor's shares, when redeemed, may be worth more or less than their original cost. Current performance may be lower or higher than the performance data quoted.
- Shows standardized pre-tax returns investors are accustomed to seeing.
- Note the % Rank in Category and compare it to the ranking in the Tax-Adjusted Return section.
- Did the fund move up or down vs. peers? A tax-managed offering should improve.
Pursuing value with tax-managed investing
In our annual Value of an Advisor study, helping clients reduce the impact of taxes is one of the greater value-adds advisors bring to the client relationship. Why? Because when it comes to investing, it’s not what investors make, it’s what they get to keep that matters most in the long run. That’s why we provide a tool that allows you to make better, more informed decisions as you demonstrate the value of tax-managed funds.

The bottom line
Bringing this tool to the marketplace in 2020 was another milestone in our drive to be an industry leader in tax-managed investing. We started this journey back in 1985 with the launch of our first tax-exempt bond fund, and we’ve been helping investors grow after-tax wealth ever since. In the late 90s we added tax-managed U.S. equity funds, introduced our tax-managed model strategies in 2003, and have followed that with product innovation in the international, real asset, and municipal high-yield bond space.
The goal of our Tax Impact Comparison Tool is to offer another way for advisors to bring even more value to their practice. The tool is designed to help advisors make informed decisions around the tax impact of investments so their clients can keep more of what they earn.