Is a recession on the horizon?
Wall of worry or slope of hope?
For the past year it feels that we've been climbing the wall of worry. Markets have had to overcome the Trump election; the Brexit fall-out; the Le Pen scare in France; the threat from North Korea and an array of monetary policies. In spite of all these worry points, markets have powered through. This then begs the question – are we about to shift from climbing up the wall of worry to falling off the slope of hope?
Well, I don't think so, or at least not yet, but there are some interesting market scenarios for the next 18 months that we have been considering. The best place to start however, is to look at what we do know.
Today, there are five things about markets that we know with some degree of certainty:
-
US economic expansion is old
It is without doubt that we have had a long and sluggish recovery from the financial crisis of 2007/2008. Age means that we are inevitably getting closer to the end of this cycle; whether that is one year away – or three – it is pretty hard to predict. My best guess for when the next US recession will hit is the second half of 2019.
-
Lots of asset classes are very expensive
Today's poster child for pricey markets is the US. Credit spreads are not far from pre-crisis lows while the long-term outlook for US equity returns is laughably small. Using various measures such as mean reversion and profit margins, our expected return for equities over 10 years is a measly 2.3%.
-
Margin debt hasn't surged… yet
Looking through history, we have been able to determine some of the most common indicators of an imminent downturn, one of which is margin debt (figure one). The grey bars represent the bear markets we have had since 1968 (as defined by falls of more than 20% in the S&P 500). As you can see, margin debt falls by roughly 40% in the lead up to the peak of a bull market and then surges just before a market downturn hits. Today, markets are certainly starting to feel a little bit euphoric, but we're not quite there yet. Despite where we are in the cycle, and the gains we've experienced over recent months, we haven't yet seen a strong acceleration in margin debt. Therefore in our view, markets could have a bit further to go and so there might be some upside left.
-
Recession indicators are still muted
At Russell Investments, we spent a lot of time looking at recession probabilities. Given the age of the cycle, we need to be extra vigilant this. Using our models, we've been able to determine that today, the recession signals are still relatively muted. Although, investors should 'stay alert, but not alarmed'. If nothing else, I suggest that yield curve is the one recession indicator to watch. Today, the yield curve spread is around 70 basis points (bps), but further tightening by the US Federal Reserve (Fed) might begin to see the yield curve invert. For example, every 25bp rate hike made by the Fed will add 25bps to the short end of the yield curve. Generally speaking, when the yield curve begins to invert, it signals that we are entering danger zone. And that might just be the signal to brace yourself, and your assets, for a US recession…
-
Central banks have shifted away from expansionary measures
We are seeing a broad shift in monetary policy across developed market central banks. In the last few months alone, we have seen the Fed and the Bank of England raise interest rates and the ECB announce 2018 tapering. The number one issue to focus on therefore is 'R*' – the latest piece of jargon that economists have recently been using more and more.
Figure 1: Margin debt since 1968

Source: New York Stock Exchange, last observation made on September 2017.
What is R*?
In a nutshell, R* it's is what economists refer to as the 'neutral' real short-term interest rate – the pivot point at which monetary policy moves from accommodative to restrictive. There is an ongoing debate amongst economists and financial markets as they try to work out where R* is today. In figure two, we have plotted the average inflation adjusted Fed funds rate over the last 30 years, and we can clearly see that it has been declining. The real short-term interest rate consistent with full employment and stable inflation has steadily declined over the last three cycles.
R* and the implications for investors
We can't directly measure R*, but it's pretty clear that it is much lower than in the past. This means we can't be sure when the Fed has raised interest rates by too much, and the economy is at risk of recession. Given that we anticipate a further three raises by the Fed, investors need to watch out for signs that interest rates have having a negative impact on the economy. This could happen at much lower interest rates than in the past.
Figure 2: R* since 1980
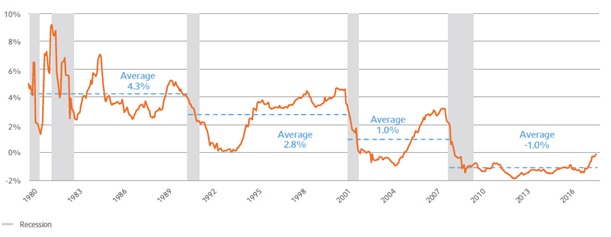
Source: Datastream, Russell Investments calculations, columns are NBER dated recessions last observation 29 September 2017.
When will recession hit?
Thanks to our cycle, value and sentiment process, we are able to devise several different scenarios showing what markets might look like in any event. In the case of recession, we have a central scenario (i.e. the most likely), a best-case and a worst-case scenario. Here's a brief overview of might happen, and when, according to each scenario:
Central scenario:
Our US strategist anticipates that we will see the Fed hike rates three times next year. If that does indeed happen, the yield curve will flatten and second half of 2018 will that will provide some big headwinds for markets, given that bear markets usually begin around 6 months before recessions.
Boom scenario:
In the event that the Fed behaves more dovishly and keeps rate hikes down, market euphoria could take hold. In this scenario, the dollar will remain weak, which will be particularly beneficial for emerging markets.
Gloom scenario:
Finally, if the Fed behaves aggressively and overtightens interest rates, or if R* turns out to be very low, the US could be at risk of recession in late 2018. Markets would probably sniff this out by mid-2018.
Cycle, Value and Sentiment
We are huge believers in the importance of structure around investment decisions. We don't take portfolio positions because we're bullish or bearish, or optimistic or pessimistic. We put each decision through our filter of cycle, value and sentiment.
We step back from the current market psychology and when making an investment decision, we have the discipline of always asking three questions:
- Is this asset class cheap or expensive?
- Is the cycle a tailwind or a headwind?
- If the market sentiment overbought or oversold, have investors crowded into a view that is overly bullish or bearish, and therefore at risk of a reversal?
A good process should have you leaning out as the risks increase and leaning back in when there are opportunities. Designed to help keep behavioural biases at bay – a process can prevent you from being sucked into euphoria by having too much risk at the peak of the market, and from capitulating with despondency at the bottom of the market. What this does mean however, is that we're unlikely to be the top performers in blow-out rally. The managers that chase momentum and buy into euphoria are of course going to do better, but how are they going to perform when the cycle inevitably turns?
We're aiming for a smoother ride and better returns. By looking at value, we are able to lean out of expensive markets, and we use our observations of the cycle and market sentiment, to help point us in the right direction.