Are U.S. housing prices unsustainable?
Is the red-hot U.S. housing market starting to lose some of its sizzle? Or is the meteoric rise in housing costs here to stay?
While home prices trend up over the longer term, it’s important to note that they can't escape business cycle forces. As Chart 1 shows, global home prices have corrected after major cyclical tops and just before recessions, like in 1980, 1990, and, of course, 2007. What's unusual this time around, however, is that the global economy is about one and a half years removed from one of the most profound economic contractions post-WWII, yet, even squinting at this chart wouldn't reveal any apparent panic in residential real estate. Global home prices have risen 26.5% since the most recent trough in the first quarter of 2013 (red dot), while U.S. housing has done even better, up 36% since then.
Chart 1
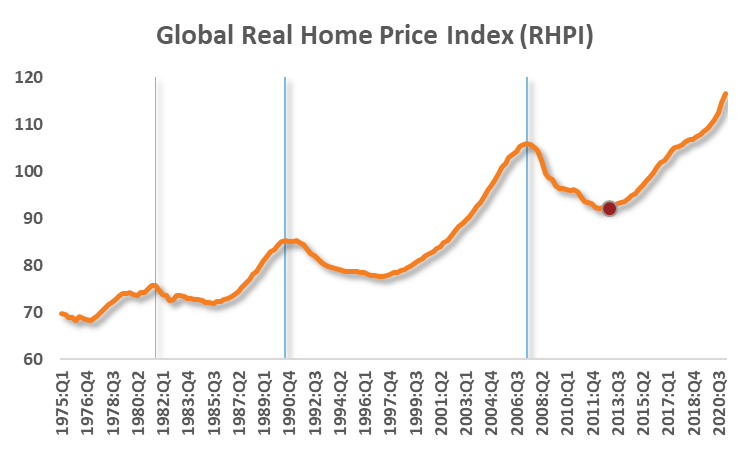
Source: Dallas Fed1, Russell Investments. As of 2021 Q1.
Key differences between the COVID recession and the Great Recession
Zeroing in on the U.S. experience reveals the extraordinary impact the Great Recession (GR) of 2008-09 had on U.S. housing. Recall that this recession centered around the collapse of residential U.S. real estate. Therefore, U.S. housing experienced a profound and drawn-out contraction that was more severe than the impact on GDP (gross domestic product), as displayed in Chart 2. Yearly changes in home prices did not turn positive until mid-2012, several years after the recession. In contrast, the experience following last year's pandemic recession has been much different. Even though the pandemic ended the business cycle and a recession followed, this did not coincide with a housing downturn. Instead, the virus acted as a propellant, with U.S. home prices appreciating over 12% yearly by the first quarter of 2021.
Chart 2
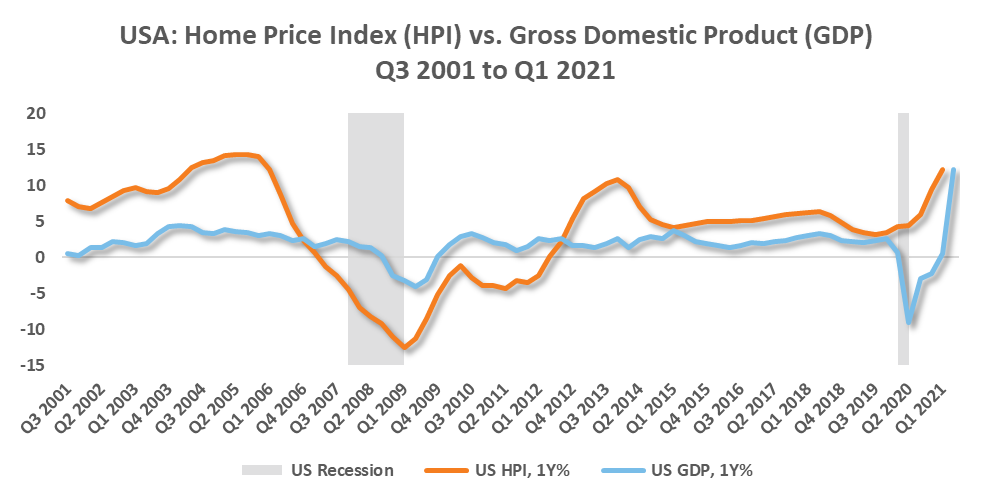
Source: Refinitiv DataStream, Russell Investments. As of June 30, 2021. Home price based on: US = S&P/Case Shiller National Home Price Index.
Considering the speed and magnitude with which prices increased, it's not surprising that housing activity has moderated since the start of the year. Chart 3 shows existing home sales have declined from a decade-best annualized pace of 6.7 million units to roughly 6 million as of July 2021. However, even this moderated pace is high relative to the pre-pandemic level. Moreover, as Chart 4 illustrates, inventories are historically tight due to this surge in demand. Nonetheless, recent trends suggest that home prices may have reached a level restrictive to potential buyers, particularly first-timers, raising the question: are U.S. housing prices unsustainable?
Chart 3
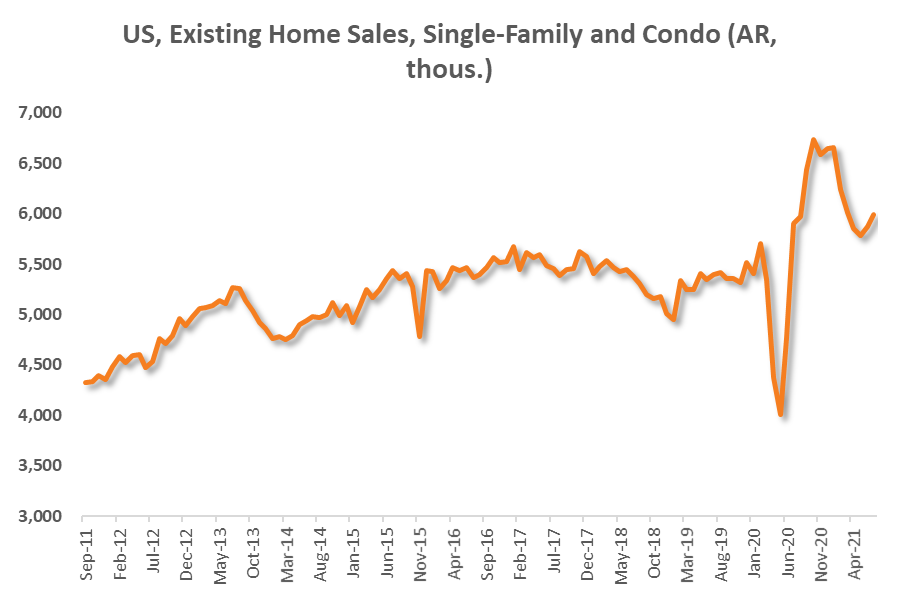
Chart 4

Source: Refinitiv DataStream, Russell Investments. As of July 2021. AR = annualized rate.
Are U.S. housing prices unsustainable? What a look at the Canadian market might indicate
The question of sustainability intersects with affordability. At a certain level, the logic is that home valuations impede affordability, and therefore prices become unsustainably high. This, in turn, reduces the demand for housing and allows prices to correct back to a level that is sustainable. While that makes intuitive sense, the theory doesn't always work in practice. The best way to illustrate this is to compare the U.S. and Canadian housing markets, with a particular focus on the home-price-to-income ratios (HP2I), as presented in Chart 5. At the start of the analysis in 2005, the HP2I ratio was similar for both the U.S. and Canada at around 4.5, which means that the average home was roughly 4.5 times the average household income. The trend has since diverged. Canadian home prices have surged to 6.7 times the level of household income as of December 2019. Meanwhile, in the U.S., the ratio is roughly the same as in 2005 at 4.5. Another way to interpret this is that Canadian homes are nearly 50% more expensive than U.S. homes when assessed on a price-to-income basis. We know home prices have risen since December 2019, but they have increased by more in Canada relative to the U.S., and, presumably, the divergence has likely widened further.
By no means are we suggesting U.S. housing is headed for a similar experience to that of our northern neighbor. Nonetheless, this demonstrates that housing trends can persist for far longer than logic would suggest, despite the apparent unsustainability.
Chart 5
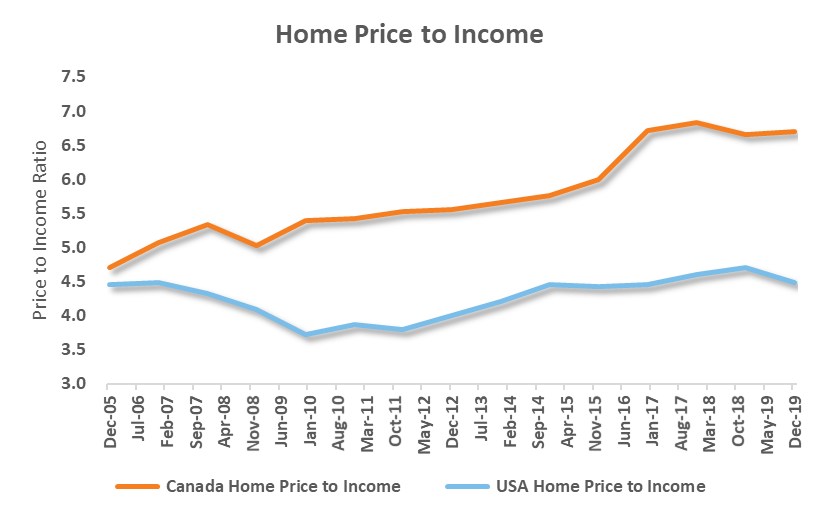
Source: Dallas Fed, StatsCan, Refinitiv DataStream, CREA, Russell Investments. As of December 2019. Based on respective single-family home price to median income.
Factors supporting today’s housing market: Higher lending standards, lower debt-service ratios
It is also worth mentioning that today's housing market is markedly different from what persisted leading up to the Great Recession. Notably, lending standards are much higher today than during the Great Recession, and this has meant that subprime loans, which were a catalyst for the housing crisis, are hardly a concern today. For instance, nearly a quarter of all mortgage origination by banks were qualified as subprime loans at the peak of the housing bubble pre-GR, versus around mid-single-digit today.2The other crucial difference is debt and household finances. In 2008, the U.S. household debt-to-GDP ratio increased to a record high of almost 100%. However, American households underwent a multi-year period of deleveraging after the housing market collapse, and the ratio has since declined to 78%, as of the first quarter of 2021. Chart 6 illustrates this progression.
Chart 6
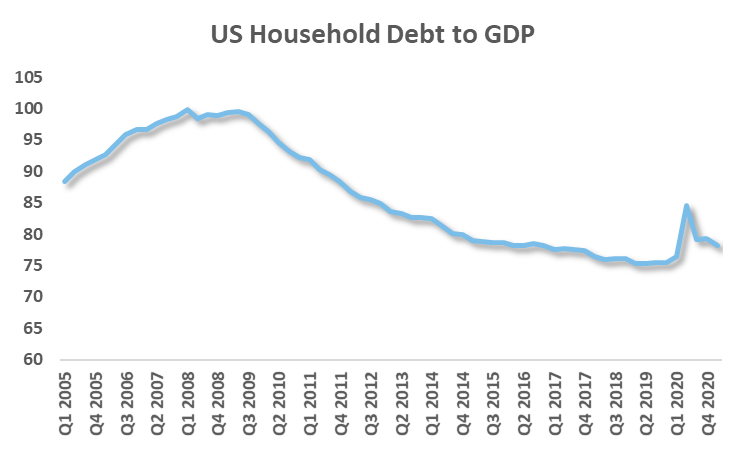
Source: Refinitiv DataStream, Russell Investments. As of Q1 2021.
Moreover, it’s not just about the absolute debt level, but crucially, the ability to service that debt. For this reason, interest rates and their influence on the debt-service ratio (DSR) are most important. The DSR measures debt servicing costs (principal and interest) relative to disposable income. Although the DSR captures total debt servicing costs associated with housing, autos, college tuition, etc., housing is typically the most significant component. The higher the DSR, the more burdensome the debt load is for the average household.
The positive here is that interest rates have trended lower over the past decade, which reduces the DSR via lower financing costs and improves affordability. This has been the case in the U.S., as seen in Chart 7. The DSR declined from a pre-Great Recession peak of roughly 13% to 10% in the first quarter of 2020. The consequences of the response to the pandemic explain what has occurred since. The DSR has since collapsed to 8% as of the first quarter of 2021, in part due to fiscal transfers and debt forbearance, which boosted disposable incomes, lowering the DSR and further bolstering household finances.
Chart 7
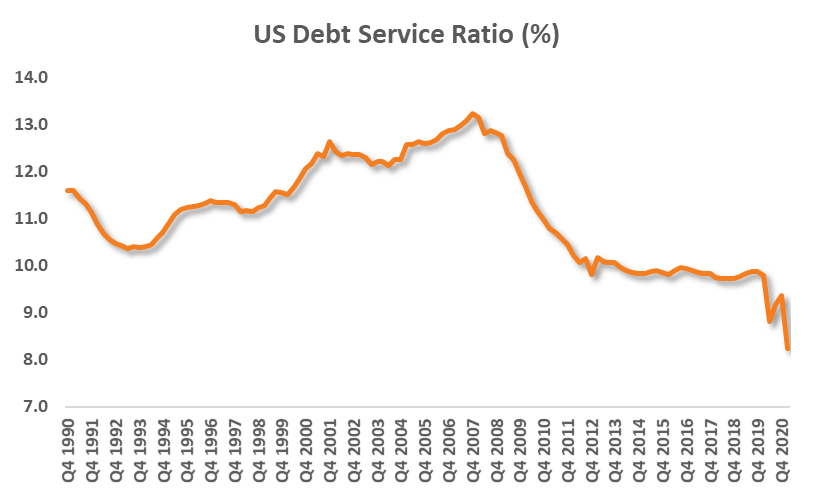
Source: Refinitiv DataStream, Russell Investments. As of June 2021.
Crucially, while high prices have some questioning affordability, analyzing home value relative to income (HP2I) and the household debt burden (DSR) reveals today's situation is a far cry from the environment that persisted before the Great Recession housing bust. The point is that low mortgage rates are supporting affordability. Moreover, as unsustainable as home prices may seem, the Canadian experience suggests that housing can ascend further under the right circumstances.
Housing market vs. equity market
Finally, this analysis wouldn't be complete without comparing the performance of housing with equities. The experience of the last two decades can essentially be split into two periods: pre-and post-Great Recession. Residential real estate was king before the housing crisis, but equities have been in the lead since, as shown in Chart 8.
A lackluster U.S. equity market recovery after the technology bubble deflated, coupled with an accelerating housing market benefiting from lowered interest rates, contributed to U.S. housing outpacing U.S. equities in the years following the dot-com bust. Housing's outperformance persisted until equities began to rebound from their post-Great Recession lows. In hindsight, the Great Recession was a decisive moment for U.S. financial markets, with the economic conditions primarily characterized as highly accommodative. The hallmarks of this period were the steady decline in interest rates and the Federal Reserve (the Fed)'s asset purchase program, also known as quantitative easing (QE). This unprecedented accommodation has resulted in a decade-plus bull market for U.S. equities—one of the best globally over this period—that was only briefly interrupted by the pandemic. Therefore, despite the slow start, U.S. equities have substantively outperformed U.S. housing through the end of this analysis period.
Chart 8
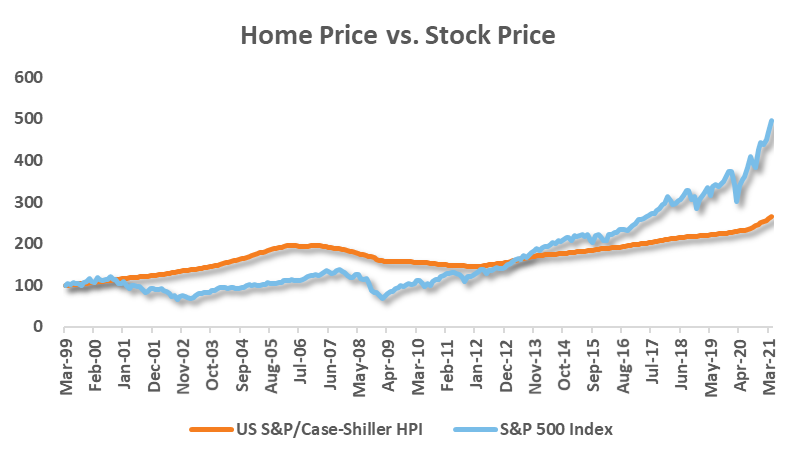
Source: Refinitiv DataStream, Russell Investments. As of May 2021.
Concluding thoughts
We’ve demonstrated economic trends significantly impact the housing market and that, therefore, housing will ebb and flow with the business cycle. Moreover, even though the business cycle remains positive, Chart 3 suggests the U.S. housing market may have entered a cooling-off period. How long this lasts remains to be seen. Still, these are unusual times, and it's clear the housing market has behaved in ways that are not typical during a recession. However, two factors that may continue to support housing are:
- The Federal Reserve influences mortgage rates, and the Fed is in no rush to raise short-term rates. Therefore, low mortgage rates support affordability.
- Housing inventory is historically tight. Limited supply with elevated demand also supports prices.
Accordingly, we believe the macroeconomic conditions may continue to promote housing fundamentals. Ultimately, improved household balance sheets, low interest rates, tight inventory and a positive business cycle point to the balance of risk for the housing market to the upside over the medium term.
1 Data related to RHPI and RHDI in this note was sourced from the Dallas Fed: https://www.dallasfed.org/research/international/houseprice;
2 Source for subprime: https://news.cuna.org/articles/print/116675-subprime-mortgages-and-the-financial-crisis