Worried about inflation? Let’s take a trip back to the future.
Everything in perspective.
It’s a phrase we’ve all heard, and we generally believe to be true. Just think about how your perspective has changed on dining out, home offices, or baking, knitting and other home-bound activities since the pandemic began. As with most things in life, your perspective depends on your experience.
That got me to thinking about some of the recent headlines on inflation. For those of us who came of age in the past two or three decades, inflation has been generally benign and rarely an issue. But for investors who have been in the markets a lot longer, the latest inflation numbers may revive memories of the early 1980s. So I thought it might be worthwhile to do some historical comparisons.
It feels like I am paying more for just about everything - groceries, gas, furniture, restaurant meals and my Friday night beer. Inflation is the highest that we’ve seen in a long time, and there are a few comments going around the internet on how to address it. One that keeps cropping up is that the current inflation rate is transitory. That’s been said for more than a few quarters now, which has led to another comment going around the internet: All inflation is transitory, until it’s permanent. It’s a tongue-in-cheek response, but historically true.
When I saw the headlines that the Bank of Canada expects 2021 inflation to hit 5%, I wanted to know when was the last time prices had risen at that pace. It was 30 years ago - in 1991! More shockingly, however, was the realization that the rate was a significant slowdown from the price hikes experienced in the previous decade - hitting a high of 12.7% in 1981!1 I couldn't imagine what it would be like to live with a double-digit inflation rate.
I wondered what the interest rate environment was like at that time in the face of such rapidly rising prices. The direction of interest rates seems to be the topic du jour for the advisors I work with and understandably so. Fixed income is a headwind for portfolios with its current lackluster performance and low rates on new issuance. A cursory Google search into bond yields in 1982 returned some downright shocking information. Bonds were yielding an average 14% at that time. Mind-blowing. So even though inflation was a concern, you were able to easily overcome its impact for your most conservative clients. Even Guaranteed Income Certificates (GICs) were returning mid double-digit rates.2
We haven’t had sizable, sustained inflation for some time, so it’s easy to forget its effect: Inflation is one of the biggest detractors of wealth creation (taxes is the other largest one). Take a look at the chart below to see the difference in performance between a conservative 20% equity/80% fixed income portfolio and a cash position over the past decade on an inflation-adjusted basis. Today is different.
Inflation: The hidden cost of cash
Click image to enlarge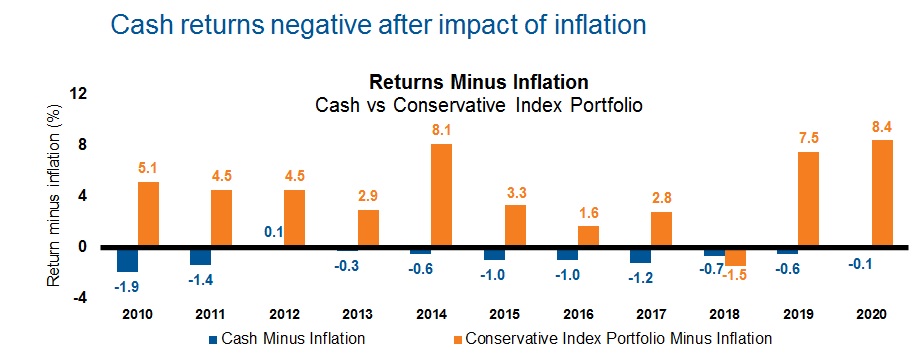
| Example | Cash | Conservative Index Portfolio |
| 2020 return | 0.6% | 9.1% |
| 2020 inflation | 0.7% | 0.7% |
| 2020 return minus inflation | -0.1% | 8.4% |
Today is a lot different. GICs haven’t been helping investors meet their financial goals. And there is more money than ever sitting in cash and equivalents: roughly $2.3 trillion as of August 31, 2021.3 This low-return environment brings a lot of risks to the forefront for your more conservative clients, such as inflation risk/purchasing power risk, longevity risk, and risk to their overall financial plan. Your clients likely continue to have the same objectives they’ve always had—such as a secure retirement, home ownership, or funding an education—but how they are going to get there might need a halftime adjustment.
While some more conservative investors might be reluctant to own equities because of even the slightest bit of risk, they’re likely needed in most portfolios. Historically equities have been a consistent contributor to portfolio performance, as they go up far more frequently than they go down. A little exposure can keep you ahead … and usually does.
Historically it has paid to own stocks
Click image to enlarge
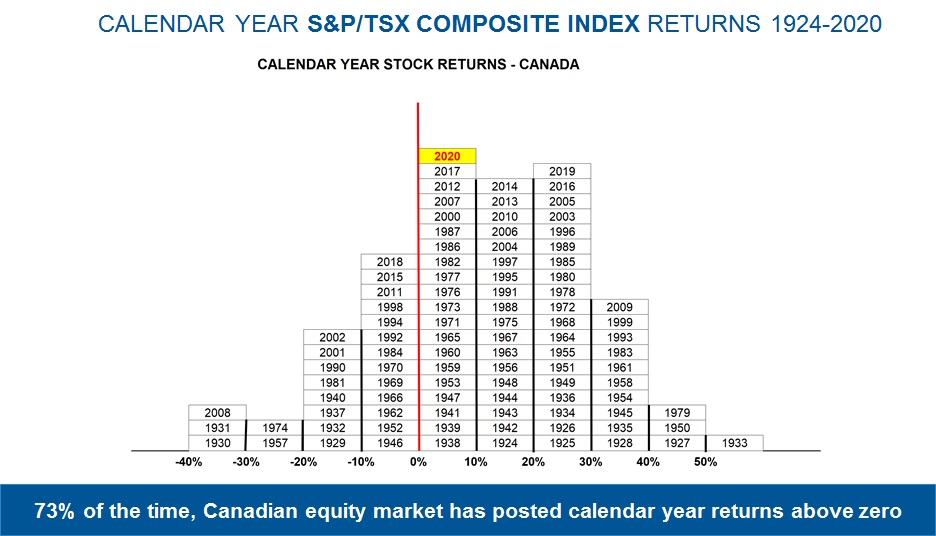
Represented by the S&P/TSX Composite Index from 1924-2020. Source: Confluence
Index returns represent past performance, are not a guarantee of future performance, and are not indicative of any specific investment. Indexes are unmanaged and cannot be invested in directly.
Cash on the sidelines?
Historically it has paid to be invested
Click image to enlarge
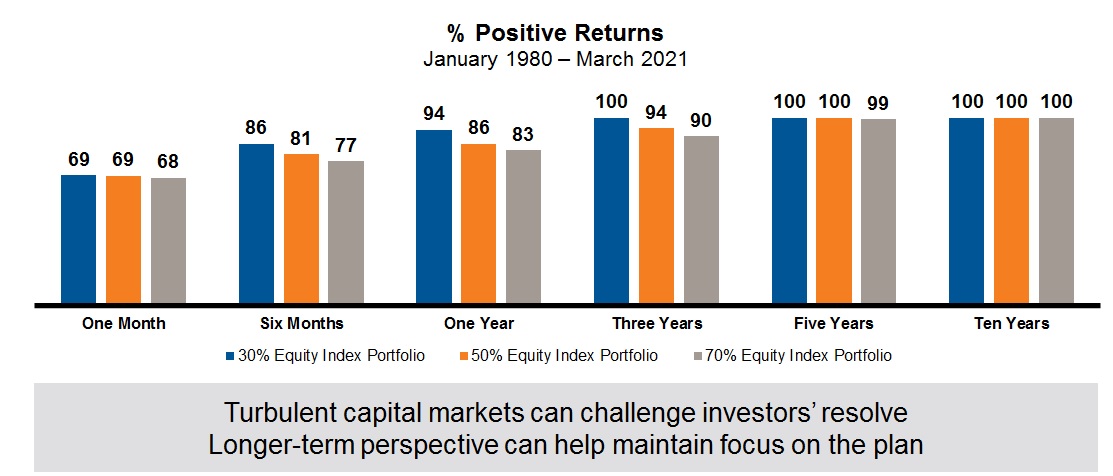
Source: Morningstar. In CAD. Three Index Portfolios Comprised of S&P/TSX Composite Index (TSX), S&P 500 Index (S&P500), MSCI EAFE Index (EAFE), and FTSE Canada Universe Bond Index (Bond); 30% Equity Index Portfolio: 10% TSX/10% S&P500/10% EAFE/70% Bond, 50% Equity Index Portfolio: 16.7%TSX/16.7% S&P500/16.7% EAFE/50% Bond, 70% Equity Index Portfolio: 23.3%TSX/23.3% S&P500/23.3% EAFE/30% Bond. Index returns represent past performance, are not a guarantee of future performance, and are not indicative of any specific investment. Indexes are unmanaged and cannot be invested in directly.
One of the primary objectives as a financial advisor is to put individuals and families in a position to meet their investment objectives while mitigating risk. We can’t eliminate risk completely, but advisors can work to minimize it and offer greater security to the financial plan. The Bank of Canada has acknowledged that inflation is above its desired 1%-3% band and now expects the output gap to close in mid-2022, making it more likely it could hike rates at that time. Since bonds and fixed rate instruments aren’t keeping pace (and might lock you in for a sizable term) what do you do?
- Have a conversation
- Talk about the past, present and future. Are their goals and time horizons the same?
- Educate your clients on the current environment
- Do they understand the lasting effect inflation and low rates might be having on their account?
- Revisit different options to maintain their current trajectory for their investment goals (I think about my son’s college fund and the long-term benefit of a bit more risk now).
- Keep perspective
- While their mortgage rate might be the lowest they’ve ever had, their money might be growing at a slower pace than it ever has.
- The investment options they’ve used before might not be doing the job in the current situation.
Like I said, their objectives have likely gone unchanged, but how they get there might need an adjustment.
1 Source: Refinitiv DataStream
2 Source: https://www.ratehub.ca/blog/the-history-of-gic-rates/
3 Based on M2 money supply. a measure of the money supply that includes cash, checking deposits and deposits that are easily converted to cash, such as bank accounts. Source for M2 data: https://ycharts.com/indicators/canada_m2_money_supply