Bulls vs. bears
Looking back over the last 90-plus years, it is unmistakable that bull markets have, on average, lasted longer than bear markets. In addition, bull markets have historically more than made up for any losses in bear markets. We believe the best approach for long-term investors is to stay invested, and dialed in on their long-term objectives.
Click image to enlarge
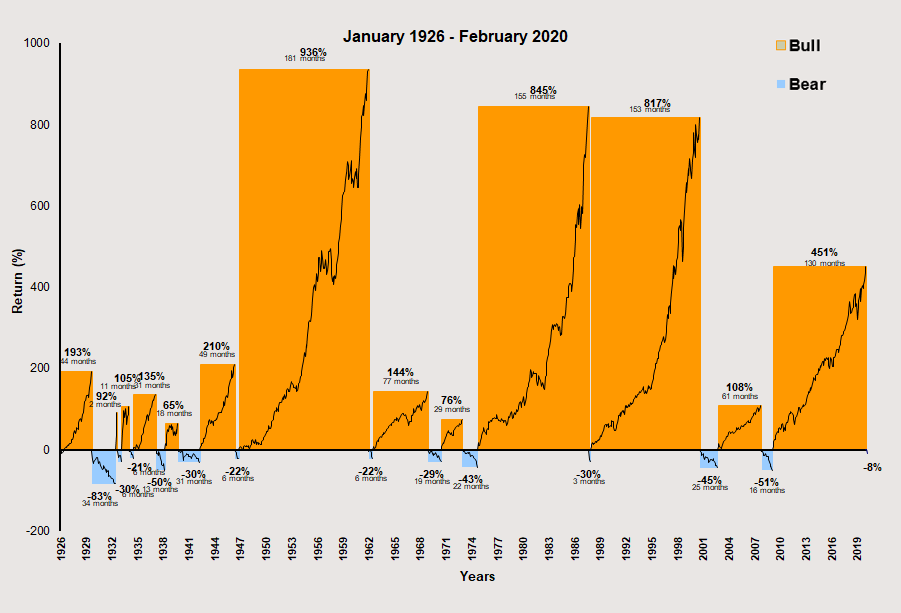
Source: Canadian Institute of Actuaries, BNY Mellon, Thomson Reuters DataStream, Russell Investments. Note: Returns prior to 1957 are based on the Report on Canadian Economic Statistics, June 2009, from the Canadian Institute of Actuaries. Returns 1957 to current are based on total return of the S&P/TSX Composite Index. Indexes and/or benchmarks are unmanaged and cannot be invested in directly. Returns represent past performance, are not a guarantee of future performance, and are not indicative of any specific investment. As of December 2019.
Over the past 95 years, as shown in the chart above, we observe 22 bull and bear market cycles, with the average bear market seeing a 34% decline, in contrast to the average bull market increasing by 112%! What’s more, the average bear market has been 15 months in duration while the average bull market has sustained for almost 38 months.
Even after periods of a more considerable downturn, most notably in the 1930s, we see that the market rebounded substantially in the years that followed. So, although exiting the market might feel like the right thing to do when volatility increases and a bear market ensues, history demonstrates this approach typically has not paid off over the long run.
5 hypothetical scenarios reviewed
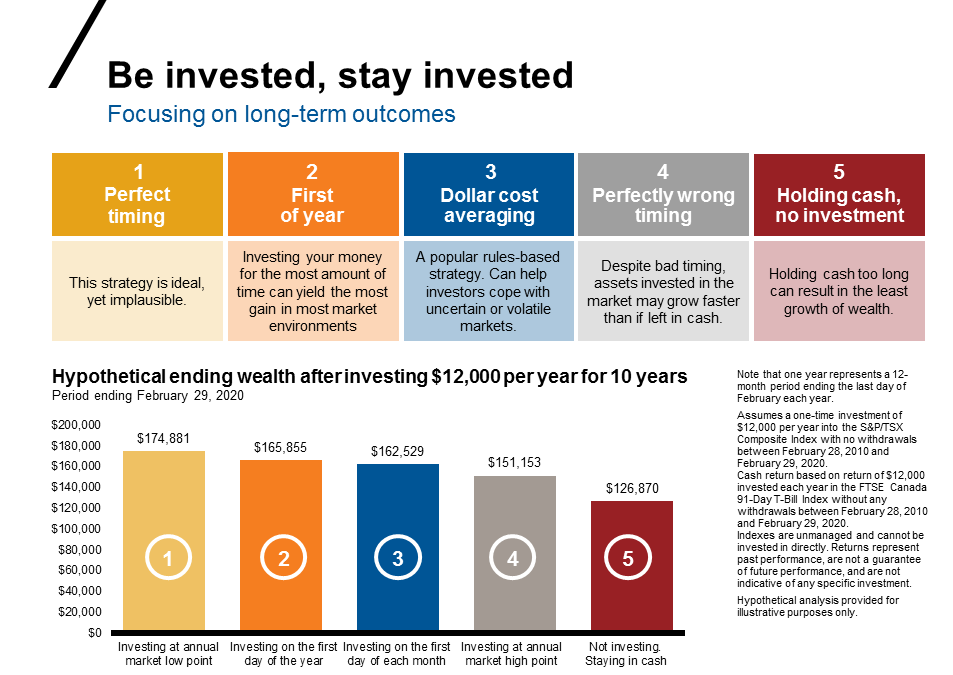
In the chart below, we lay out five distinct hypothetical accounts, with $12k invested in each account annually over a span of the last 10 years. Short of possessing a magic crystal ball, being invested—and staying invested—would yield the best outcome for the long-term.
- The first scenario, or crystal ball scenario, assumes perfect market timing and invests at each annual market low point. Of course, this is optimal, but pretty much impossible; however, using historical data to calculate this scenario over the past 10 years, an investor would have made $175k with impeccable market timing.
- The second scenario assumes the annual investment is made every year on January 1. It allows for the longest amount of time possible, and would yield the second-best result or next-best strategy of $166k.
- The third strategy, called dollar cost averaging, is based off investing once per month. This strategy is very practical for most investors in the market for several reasons, but the principal reason relates to pay schedules and having cash available to invest. Investing on a monthly basis allows investors to get their money in the market and ride out some of the month-to-month volatility by not putting all their money in the market before a big drop. The difference between strategies two and three is relatively modest, and while the second strategy has been better in nearly all market environments, the third strategy is likely more realistic and easier to implement for most investors because not everyone has large sums of cash to invest at the start of the year.
- The last two scenarios show the negative impact of investing with the absolute worst timing for the last 10 years, or of just sitting on the sidelines in cash. While both outcomes would have fallen short of the first three, even the perfectly wrong timing scenario would have yielded a total accumulation of more than $150k. Unsurprisingly, the holding cash scenario would have resulted in negligible gain.
Click image to enlarge
The bottom line
Time is on your side. By setting long-term objectives and possessing the discipline to stay invested through the ups and downs of the market, we believe a diversified portfolio has the best probability of meeting its goals.