Some stories you can tell the fearful investor
Last week, I was driving home from a business trip when I suddenly got a call from my parents. They were just checking in to see how things were. Before long, I started to get peppered with all kinds of questions about recent market events. What did I think about the Russia/Ukraine situation? Was inflation going to persist? Will rising interest rates threaten their bond portfolio?
The recent headlines had them a bit spooked, so they wanted someone who they trusted and was in the industry to help ease their concerns.
I was flattered at their trust in my knowledge, and it made me think about all the conversations I've been having with advisors over the last few weeks.
Inflation continues to roar its ugly head, interest rates are being raised, and there is geopolitical military conflict in Europe. Clients are worried, and naturally advisors have been calling us asking what we think.
The power of perspective
In a moment I'd like to introduce you to my business partner and colleague, Chris Kalman. Together we run the Ottawa sales region for Russell Investments Canada. Over the last few weeks, Chris and I have hosted many calls with advisors and investors, answering their questions and providing insight into the latest market events.
Most of the time, we are not discussing the details of what is happening in the markets. Rather, we spend our time giving clients a better perspective on market trends over the longer term. We have found that when we zoom out and give clients a history lesson, we can help alleviate their short-term concerns, and keep them focused on their long-term priorities.
With that, let me hand this over to Chris and have him begin our discussion on helping clients through this volatile time.
*Hands proverbial microphone to Chris Kalman, Regional Consultant for the Ottawa Region.*
Thanks, Jack! As mentioned, we have talked to a lot of clients in the past few weeks to help them interpret these recent market events. With so much uncertainty in the world, clients have been asking, should I invest right now? With inflation, Russia/Ukraine, interest rate hikes and the upcoming mid-term elections in the U.S., it seems there are many reasons not to invest in the markets. It's a valid question.
But the tricky part is, there is always a reason not to invest in the markets. No matter what time frame you look at, there is always something going on that could present a threat to financial markets.
The question is: what information do we need to make the best decision, considering constant and ever-changing uncertainty?
The answer: we zoom out and provide perspective.
Story 1: History shows it pays to own stocks
This holds true for the U.S., Canada, and all other developed markets. The chart below shows the calendar year returns for Canadian equities, represented by the S&P/TSX Composite Index. Everything to the left indicates years when the S&P/TSX Composite Index had a negative return.
Click image to enlarge
Historically, it has paid to own stocks
CALENDAR YEAR S&P/TSX COMPOSITE INDEX RETURNS 1920-2021
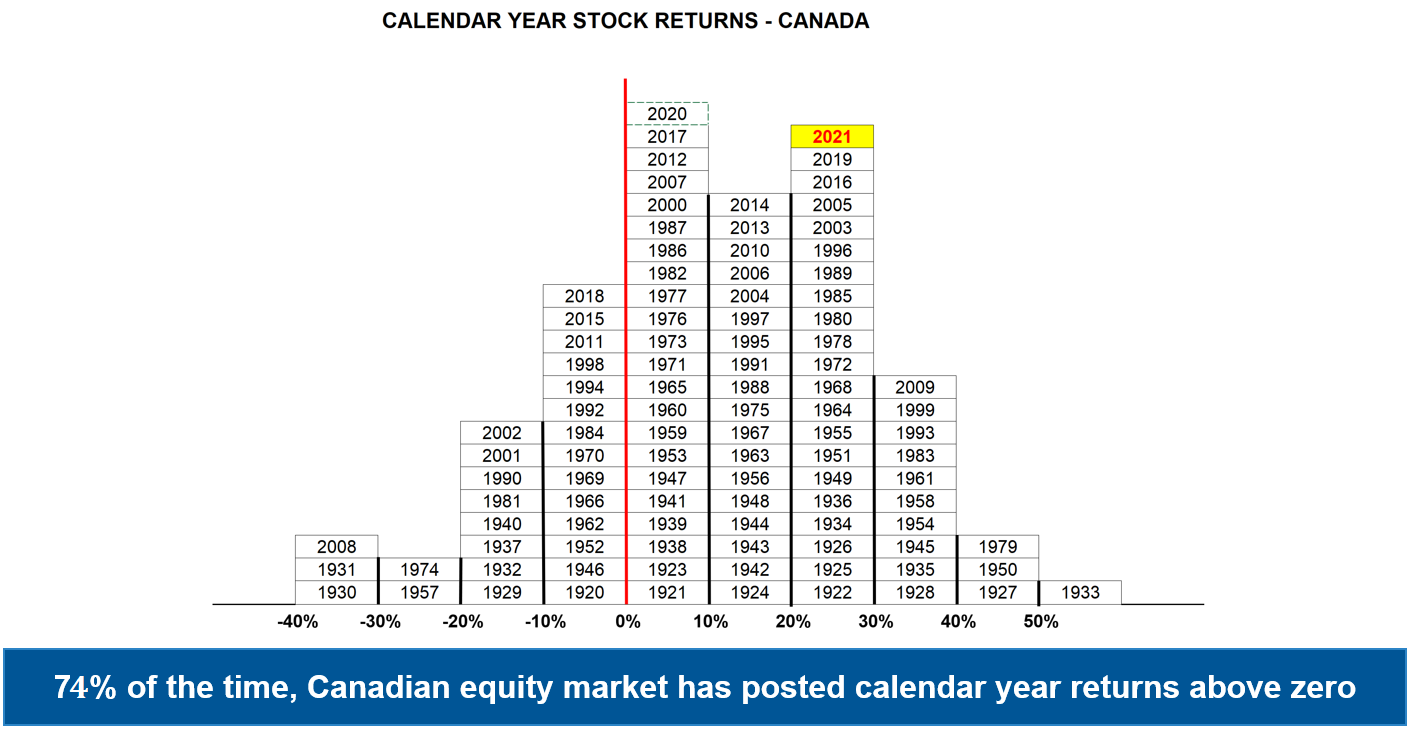
Represented by the S&P/TSX Composite Index from 1920-2021. Source: Confluence
Index returns represent past performance, are not a guarantee of future performance, and are not indicative of any specific investment. Indexes are unmanaged and cannot be invested in directly.
The first thing I'd like to point out is how many more years are positive compared to years that are negative. The difference is visually staggering. In fact, from this data we can see that since 1920, the Canadian stock market has ended the year positive 74% of the time.
Those are incredibly good odds, and to help us understand that a bit better, let me pass the mike back to my colleague Jack. Over to you Jack!
*Jack Eaton, Regional Director, Ottawa Region*
Thanks Chris! Many times, clients ask us whether investing is like gambling. Wouldn't you just be better off going to a casino and throwing all your money on red? It's a good question, so let's explore it.
We know from the data Chris just shared that 74% of the time the market is positive. That means seven out of 10 years the market is paying you. So, let's put that into a gambling context.
Imagine you're in a large casino in Las Vegas. You find yourself perusing the slot machines and you sit down and begin putting your coins in and cranking the handle. As it turns out, this slot machine is magical. For every 10 times you crank the handle, the slot machine pays out seven times.
Now let me ask you some questions. If a slot machine with these odds did exist, what would your strategy be?
Would you try to time the three out of 10 times when the slot machine took your money? Would you try to avoid those times when you lose money? Or, if you knew that you would receive a payout in seven out of 10 attempts, would you simply sit there and crank the handle as many times as you possibly could to take advantage of the odds?
I think many of us know the answer. With a 74% chance of success, the winning strategy would be to sit there and crank that handle until your arm fell off.
The best odds on the floor
Unfortunately, this type of slot machine does not exist in Las Vegas nor anywhere else. However, the good news is that most stock markets do offer these odds. They have a much better payout ratio than any game you might play on any casino floor. For that reason, we want clients to understand that the key to winning in the game of investing is not to try and time the three out of 10 years when the market may be negative.
Instead, we find that the best strategy is to keep your money invested for as many days as you possibly can. Because each day is like another crank of the proverbial handle. Each day is another opportunity to stack the incredible odds of success in your favor.
Nobody knows if this is the right time to get into the market or not. Nobody has a crystal ball. The market may be negative this year, or not. There is no way to know in advance.
All we can do is consider previous patterns and anchor our best long-term decisions from what we know to be true: If your money has long-term goals, history tells us that it pays to own stocks, no matter what they might do in the short-term.
Let me hand it back to Chris and let him introduce our second concept to help clients through volatile markets.
Story 2: Getting in the game
*Chris Kalman, Regional Consultant, Ottawa Region*
So, we've seen that even though markets can be volatile in the short-term, we know that over longer periods of time the market does a good job of paying us more often than not.
Yet it is still tempting to believe that market timing produces material results. We still have the tendency to think that if we just got in at the right time, that would give us the best result.
The next story we’d like to walk through considers this very exercise. Let's examine who will do better, the investor who keeps cranking the handle by remaining invested, or the one who tries to time the market.
Market timing versus systematic investment
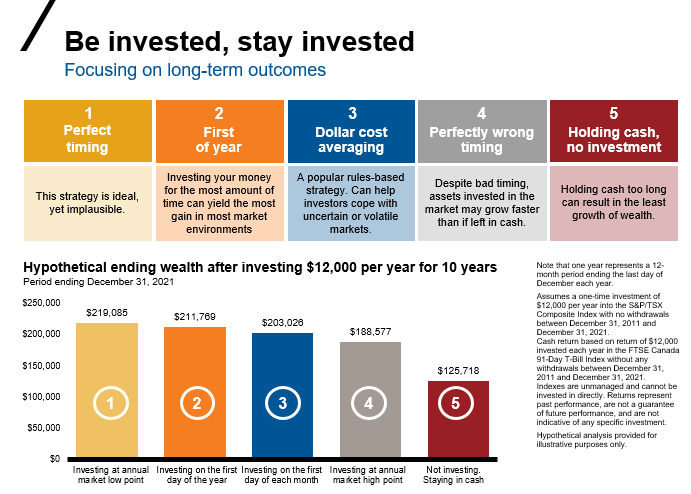
Here's the hypothetical scenario. Let's say I gave you $12,000 every year for the past 10 years. Let's break down a few scenarios of what you could do with this money.
Click image to enlarge
Holding cash (number 5)
The first thing you could do, and in fact it's something that many clients are doing right now, is put the money into a savings account and earn a very small rate of interest.
Your money is safe, protected up to the CDIC (Canadian Deposit Insurance Commission) limit. Your cash does not fluctuate in value when the market goes up or down. This comforts you. You like the stability. However, the cost is that your cash does not earn a very high rate of return. At the end of the 10-year period, the $120,000 you deposited in total is now worth $125,718 (see chart above).
Poor market timing (number 4)
Now let's look at an alternative. Suppose you decide to take the initial $12,000 and invest in the market, as represented by the S&P/TSX Composite Index. But it just so happens that you are the unluckiest investor the world has ever seen. Whether by dark fate or incredibly bad fortune you happen to invest your $12,000 on the market high point in that given year. And not only do you perfectly time the market wrong, you go on to invest at the market top every year, for 10 years in a row.
You are truly the world's unluckiest investor with perfectly horrible market timing. You get it wrong for 10 years in row. Ouch. That hurts.
At the end of the 10-year period, however, you discover that your ending account value is $188,577.
Wait a minute. You're telling me I got it wrong for 10 years in a row and I made $62,859 more than if I had left my money in savings?
Yep, that's what I’m telling you. Let's look at another example.
Perfect market timing (number 1)
Now let's look at the exact opposite scenario. Let's say you invest your $12,000 each year on the perfect day to invest—the annual market low point. And let's say you get it right for 10 years in a row. You are, in other words, the luckiest investor in the world.
By the end of the 10-year period your $120,000 is worth $219,085.
Systematic investing (number 3)
Finally, we come to the approach that we have been recommending throughout: systematic investing. Suppose instead of trying to perfectly time the market, or keeping your money in savings, you decide instead to put $1,000 into the market each month throughout the year.
In other words, you build a process and follow it (like cranking a handle). You don't try to guess when it's the best time to get in. You just crank the handle each month and put more money into the market.
By the end of the 10 years your $120,000 is worth $203,026.
First of the year (number 2)
We didn't forget about this one, which could come up in conversations with clients. They might ask something like, why don't I save my money and invest it at the first of the year? That looks like something I can control?
This comes down to behaviors and personalities.
There are two types of people: Spenders and savers.
The savers might have a hard time getting the cash out of the savings account to invest. It feels nice to see that money in there. They may hesitate to invest, making them act like Number 5 in the chart above.
The spender is different. They might be able to save the $12,000 every year, or they might look out the window and see that new car. They could scroll through social media and see that fancy trip. If that's the case, they might end up worse than number 5, by investing nothing at all.
What did we learn?
To summarize what this means let me pass the microphone back to Jack.
*Jack*
This is a powerful study because it directly addresses the lingering question in our head: does market timing really make a big difference?
Let's examine the results quickly. If you held cash for 10 years, you made just over $5,000. If you timed the market wrong for 10 years in a row, you made $68,577. If you timed the market perfectly right for a decade, you made almost $100,000, and if you systematically invested, you ended up right in the middle, making around $83,000.
This is truly amazing because it shows that even if you perfectly got things wrong for an entire decade, you still made way more money than if you just kept your money in a savings account. And if you got it perfectly right for a decade you made more, but not that much more.
Systematic investing gives you a practical way to achieve results that are almost as good as if you had perfectly timed the market for a decade. That's because the odds of this are overwhelmingly stacked in your favor. The market typically pays you 74% of the time. That means it doesn't significantly matter when you are getting into the market, whether at a high point or a low point. Over time, the probabilities of the market will continue to push your wealth higher and higher, reducing the effect of any possible poor market timing.
It does not matter when you get in the game. It just matters that you get in.
Story 3: Count on the bulls
*Chris*
We've gone through two examples that show the odds of the market are in your favor. We’ve also shown how systematic investing can be a practical way to take advantage of those odds. Now let's dispel your fear of the bear markets once and for all.
When talking with clients ask this question:
When was the last time you remember something good or bad happening in the markets?
Most likely their answer will be something bad that happened. Maybe they remember 2008 or March of 2020. This is most likely due to the emotional impact of the market decline and everything that came with it: they remember people losing jobs and homes in 2008; they remember being scared, locked down and trying to navigate their first pandemic in March of 2020.
Then ask them, do you remember what the market did in 2020, or can you tell me when the market was positive?
They will struggle with this one. People tend to remember the bad times over the good. This happens daily in life, markets, customer service, just about anything.
I could ask you right now: tell me about a time you had bad service? You could rattle off five to 10 examples. If I ask you to tell me about a time you had great service, you will pause and maybe come up with one memory.
It's the same for investors.
At Russell Investments, this next chart is something of a celebrity. It's the classic oldie, but a goodie.
You'll notice there are orange bars and there are blue bars. The blue bars on the bottom represent all the bear markets going back to the 1920s. These show us the magnitude of the correction, and the duration (how long it persisted). The orange bars show us the bull markets, in both magnitude and duration.
Click image to enlarge

Source: Canadian Institute of Actuaries, BNY Mellon, Thomson Reuters DataStream, Russell Investments. Note: Returns prior to 1957 are based on the Report on Canadian Economic Statistics, June 2009, from the Canadian Institute of Actuaries. Returns 1957 to current are based on total return of the S&P/TSX Composite Index. Indexes and/or benchmarks are unmanaged and cannot be invested in directly. Returns represent past performance, are not a guarantee of future performance, and are not indicative of any specific investment. As of December 2021.
Bull, bear and neutral markets: Bull markets are markets where the cumulative returns exceeded 20%; Bear markets are determined to be markets where cumulative returns were lower than -20%; Neutral markets are defined as those where there was no clear directional trend and returns were cumulatively in the range of +5% to -19%.
*Jack*
This is a stunning visual display of the 7/10 odds. Why would you be concerned about bear markets (in blue) when you get to participate in all the bull markets (in orange)? Bear markets can indeed be painful in the moment. It never feels good when your account value is negative. However, we suggest you zoom out and look at the broader context. History shows us that any bear market is soon to be followed by an even stronger bull market. Again, the odds are on your side, massively.
Many clients are concerned about bear markets, but that's only because they don't understand how bull markets will compensate them over time. May this chart provide perspective.
The bottom line
There will always be a reason to feel like it might not be the right time to invest. Every day, week, month, or year there will be a crisis or issue that seems to threaten the viability of markets. Despite this uncertainty, markets have tended to prove resilient to challenges and obstacles.
In our role as investment consultants, we meet many advisors and investors. We hear their fears, we take their questions, we listen to their stories. Whenever there is concern over the latest happenings in the market, we have always found that the best solution is to take a breath, step back, zoom out and get the long-term perspective.
Perspective will always help you make better decisions. Feel free to use these stories for your own investment endeavors.
This blog was originally written by Roman Samuels and George Wakim of Russell Investments for a U.S. audience.