4 psychological reasons investors buy
Early on in my career, I learned there are four psychological reasons investors buy (listed from strongest to weakest):
- Pain in the present
- Pain in the future
- Pleasure in the present
- Pleasure in the future
Living in Michigan, and a die-hard hockey fan, I frequently use this example to illustrate present and future pain and pleasure with my clients ...
Pain in the present
Let's assume you take your family to a Detroit Red Wings game in January. Following the game, it's late, snowing and the wind is whipping--in other words, horrible driving conditions. You're driving north on I-75, and hit one of the infamous potholes. BAM, you blow two tires. You safely make your way to the shoulder, and realize you have no choice but to call for help.
By the time the tow truck driver arrives, the kids are losing their minds, and everyone has reached their boiling point. The once-fun evening has turned frustrating, and the weather conditions are worsening by the minute. The tow truck driver takes a look at your two blown tires, and states that he can put two new tires on your car right now for a cost of $600. How fast do you take out your credit card and pay to solve the problem? You are in pain... pain in the present, and you are willing to pay to get out of it fast.
The above example of doing whatever it takes to get out of an unpleasant situation is similar to what many investors may have felt in the fourth quarter of 2018. Over that time period, global equities (as shown in the chart below) had one of their worst quarters since 2008, dropping 13.4%. In response to the volatility, according to Morningstar, investors pulled more than $120 billion from open-end mutual funds and ETFs during the quarter.1 For the first time, quarterly redemptions surpassed the nearly $110 billion that investors pulled during the middle of the global financial crisis in the fourth quarter of 2008, when global equities plunged over 22%.1,2
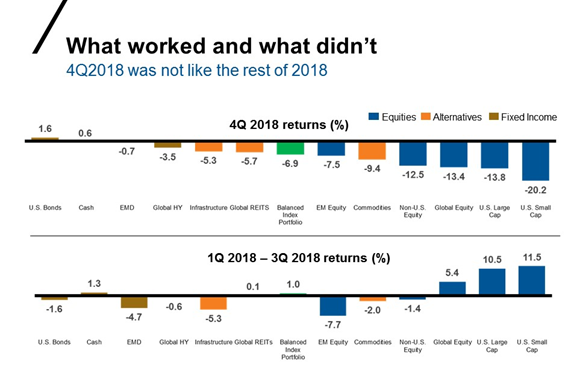
Source: U.S. Small Cap: Russell 2000 Index; U.S. Large Cap: Russell 1000® Index; Global: MSCI World Net Index; Non-U.S.: MSCI EAFE Net index; Infrastructure: S&P Global Infrastructure Index; Global High Yield: Bloomberg Global High Yield Index; Global REITs: FTSE EPRA/NAREIT Developed Index; Cash: FTSE Treasury Bill 3 Month Index; EM Equity: MSCI Emerging Markets Index; U.S. Bonds: Bloomberg U.S. Aggregate Bond Index; EMD: JPM EMBI Plus Bond Index; Commodities: Bloomberg Commodity Index Total Return; Balanced Index: 5% U.S. Small Cap,15% U.S. Large Cap, 10% Global, 12% Non-U.S., 4% Infrastructure, 5% Global High Yield, 4% Global REITs, 0% Cash, 6% EM Equity, 30% U.S. Bonds, 5% EMD and 4% Commodities. Index returns represent past performance, are not a guarantee of future performance, and are not indicative of any specific investment. Indexes are unmanaged and cannot be invested in directly.
In both cases, for some investors the pain in the present of losing money during difficult periods for equity markets caused them to abandon their investment strategy. They likely picked up the phone and called you with a clear decision: sell now and move to cash. A short-term decision, made in an instant to avoid or relieve the throbbing headache caused by downward markets--the pain in the present. To some, this rapid market exit in and of itself may look painful--after all, the investor is selling her or his current investments. From the vantage point of the investor, however, she or he is simply buying cash by selling out of the market. To the investor, there's a perceived safety in leaving the market to avoid the immediate pain of volatility.
However, as discussed in a previous blog trying to time the market typically has not been a winning strategy for many investors. Staying the course and remembering that over the long-term, diversified portfolios historically have produced positive returns most--if not all--of the time can help individuals stay invested during periods of uncertainty.
Pain in the future
Here's a different scenario to envision: you take your car in to get a $19.99 oil change. Included in the package is a complimentary 120-point inspection of your vehicle. The mechanic tells you he'll get to work on your car, and to feel free to come back in an hour. So, to kill the time, you walk next door, grab a cup of coffee and spend the next hour reading the paper.
Upon returning, the mechanic tells you the car looks great, but they did notice the tread on your two front tires is fairly low, and they recommend purchasing new tires today. The first question you ask is, How low?--to which the mechanic responds, 2 millimeters. Now, if you're like me, that doesn't mean much--i.e., is that kind of bad or really bad? So you ask the next question, how long do I have?, followed by how much will it cost?
In other words, you're assessing the potential timing of the pain--now, or in the future? And you're also trying to calculate how long into the future you have before this situation may become urgent. If you decide your tires are unlikely to get you into trouble before the next oil change, you'll probably pass on a new set, as the pain of the cost today is worse than the pain of potentially blowing a tire. But the potential for pain still remains.
Pleasure in the present
Investors face this dilemma every time they're deciding between whether to spend money now for present consumption and instant gratification, versus delaying that consumption and investing with the hopes that their money will grow and can be used to purchase even more in the future. It can be quite difficult for investors to weigh the pros and cons of spending now for pleasure in the present against investing for the hope of pleasure in the future--or perhaps, more importantly, to avoid the potential pain in the future of running out of money.
Pleasure in the future
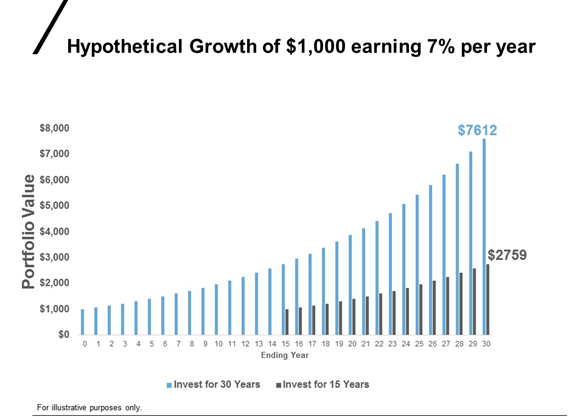
The longer the time horizon the investor is working with, the more time for the investor's returns to compound and grow larger for use down the road.For example, assume an investor in a balanced 60/40 portfolio consisting of stocks, bonds and real estate earns an average rate of return of 7% per year, which is near the average return for a portfolio of those asset classes over the last 30 years.3If an investor put away $1,000 30 years ago and earned an average return of 7% per year, that initial investment would have grown to over $7,600 today for a total return of over 660%. However, if that investor decided to place pleasure in the present over pleasure in the future and invested for 15 years, as opposed to 30, that same $1,000, earning 7% per year, would only grow to a little over $2,750--for a total return of just 176%. Cutting the investing time horizon in half, the investor's total return drops significantly more than that to only about one-quarter of what was earned over the 30-year horizon. Put simply, when it comes to investing, time truly is on the investor's side.
What does this mean today?
At Russell Investments, we believe a recession appears in store for the U.S. by the end of 2020--and possibly sooner. So why not start preparing for those client conversations now? We believe the best advisors focus on helping their clients stick to their long-term financial plans--their outcomes. As an outcome-oriented partner, we see it as prudent to steeryour investors away from chasing returns.
In a similar vein, we also believe taking a global, multi-asset approach can help investors avoid the common pitfall of moving into or out of an asset class at the wrong time. Lastly, and perhaps most importantly, we believe that what works best is time in the market--the period of length in which you're invested--versus trying to precisely time the market to maximize gains and offset losses.
The bottom line
As we begin 2019, consider how you are approaching your conversations with clients to illustrate the benefits of dealing with potential financial discomfort before it occurs.
After all, sometimes a little pain is part of the process.
1Source: Morningstar®Direct, estimated net flow data.
2 MSCI World Index
3 A hypothetical balanced portfolio consisting of 39% U.S. stocks (S&P 500), 17% non-US stocks (MSCI World ex-USA), 4% Real Estate (FTSE NAREIT All REIT) and 40% bonds (Bloomberg US Aggregate Bond Index) returned 7.8% from 1989-2018.