Commodities may be poised for a comeback
Since the Great Financial Crisis, most risk assets have delivered a relatively enjoyable investment experience. U.S. large cap equities (Russell 1000® Index) achieved annualized returns of +16.8% from the first month after the market bottom, April 1, 2009, to March 31, 2018. Overseas, non-U.S. developed equities (MSCI EAFE Index) also impressed with double-digit annualized returns of +10.5%. REITs (FTSE EPRA/NAREIT Developed Index) results have been notable as well, with annualized returns of +18.6%.
Commodities: the post-GFC outlier
One asset class that hasn’t participated in this lengthy bull market, however, is commodities – which provides economic exposure to natural resources (such as oil, gold, timber) and raw materials (for example wheat, corn, pork bellies) typically used to produce many products around the world. Commodities (Bloomberg Commodity Index) have struggled, delivering a negative annualized return of -2.3% from April 1, 2009 to March 31, 2018.
It should not come as a surprise then, that many investors have decided to look elsewhere for returns within their portfolio’s allocation. At the end of the first quarter of 2013, total net assets in open-end mutual funds and ETFs stood at approximately $148 billion. Less than three years later—by the end of 2015—that figure stood at $65 billion. In that short time period, $33 billion in assets exited commodities funds! While some investors ventured back into the asset class after the 2015 low, they still haven’t reached their previous high-water mark again.
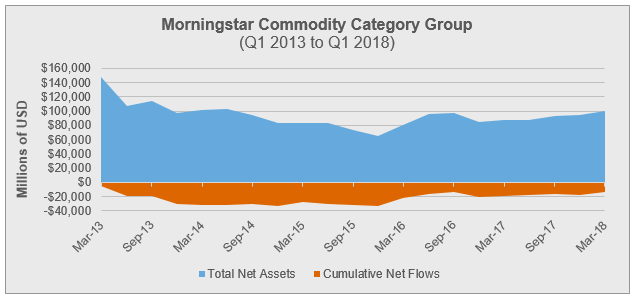
Source: Morningstar Direct, March 31, 2018. Morningstar Commodity Category Group = US Fund Commodities Agriculture, US Fund Commodities Broad Basket, US Fund Commodities Energy, US Fund Commodities Industrial, and US Fund Commodities Precious Metals.
This negative sentiment toward commodities has not always existed. In fact, if you look back at the decade prior to 2013, the Morningstar commodity category group gathered over $115 billion from the fourth quarter of 2002 to the fourth quarter of 2012, with total net assets in the asset class peaking at over $166 billion in the third quarter of 2012:
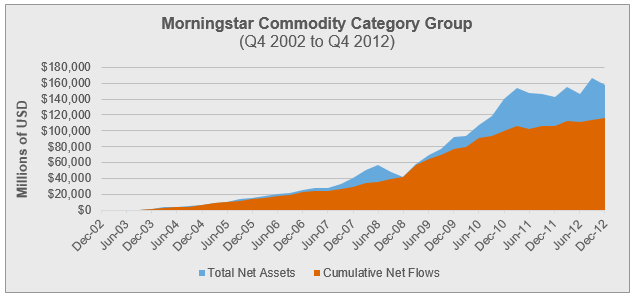
Source: Morningstar Direct, March 31st, 2018. Morningstar Commodity Category Group = US Fund Commodities Agriculture, US Fund Commodities Broad Basket, US Fund Commodities Energy, US Fund Commodities Industrial, and US Fund Commodities Precious Metals.
We still believe commodities have an important role within a multi-asset portfolio
Despite the performance challenges the asset class has faced during the current market cycle, we at Russell Investments maintain our strategic belief in commodities as part of a well-diversified multi-asset portfolio.
So, in addition to the strong outlook for many commodity constituents at this point in the market cycle, we thought it may also be helpful to revisit the rationale for commodities from a strategic allocation perspective, which includes the following key points:
- Commodities’ diversification benefits; and
- Commodities’ role as a potential hedge against unexpected inflation.
Diversification
While traditional asset classes like stocks and bonds may be the starting point for most investors’ portfolios, real assets like commodities, real estate, and infrastructure have the potential to add valuable diversification benefits to an overall portfolio.
This can be illustrated by examining historical correlations between the returns of the Bloomberg Commodity Index relative to the returns of other traditional asset classes:
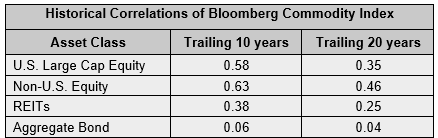
Source: Morningstar Direct, March 31st, 2018. U.S. Large Cap Equity = Russell 1000 TR USD; Non-U.S. Equity = MSCI EAFE NR USD; REITs = FTSE NAREIT All Equity REITs TR USD; Aggregate Bond = Bloomberg U.S. Aggregate Bond TR USD Index.
As the table above illustrates, commodity returns have had lower positive correlations historically to traditional asset classes. For example, over the past 20 years, commodity returns have a fairly low positive relationship with U.S. large cap equity (+0.35), non-U.S. equity (+0.46), and REITs returns (+0.25), while they’ve demonstrated virtually no relationship with U.S. fixed income returns (+0.04). Contrast that to U.S. large cap equity and non-U.S. equity, for example, whose returns have been strongly correlated over the past 20 years (+0.86) as of March 31, 2018.
Considering the recent volatility experienced by both equities and bonds, along with U.S. equity markets remaining relatively expensive despite these recent results, maintaining an allocation to asset classes with low correlations could potentially provide the cushion clients are looking for should volatility persist in capital markets moving forward.
Relationship with inflation
Inflation is another reason a strategic allocation to commodities may benefit investor portfolios.
Consider the chart below, which compares the rolling one-year returns of the Bloomberg Commodity Index relative to the year-over-year change in the Consumer Price Index (CPI) over the past 27 years ending March 31, 2018. The CPI tracks the changes in prices of consumer goods and services, including food and energy, serving as a broad measure of inflation given the commodity exposures represented in the Bloomberg Commodity Index. As you can see, there is a clear historical relationship between the change in prices of commodities and the returns of the commodity asset class:
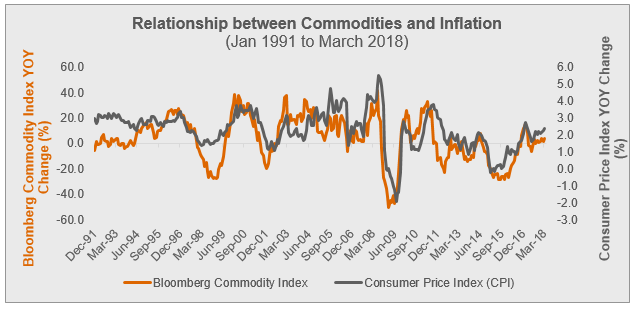
Source: Morningstar Direct, Federal Reserve Economic Data (FRED). Data as of 03/31/2018. Bloomberg Commodity TR USD Index & CPI: Consumer Price Index for All Urban Consumers – All items, Percent Change from year ago, monthly, seasonally adjusted. Methodology: Rolling 1 Year period returns illustrated with one-month step. Index returns represent past performance, are not a guarantee of future performance, and are not indicative of any specific investment. Indexes are unmanaged and cannot be invested in directly.
Why does the relationship between commodities and inflation matter right now?
While it is true that since the Great Financial Crisis inflation has been considerably low, the year-over-year percentage change in CPI has been trending up year to date as of March 31, 2018. According to Federal Reserve Economic Data, the CPI stood at 2.4% for the month of March, marking its eighth straight month above 2.0%.
From a historical perspective, this is a critical development. As you can see below, commodities (along with real estate securities) have historically performed well during inflationary environments, averaging a 13.3% return per year when annual inflation readings were at least 2.5%:
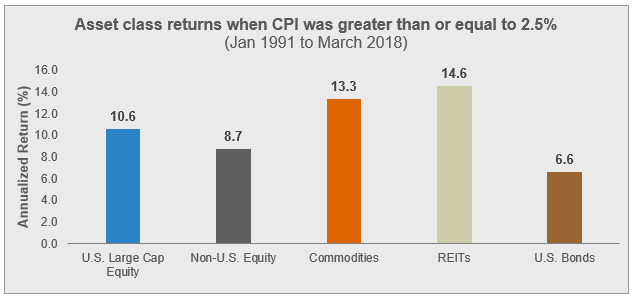
Source: Morningstar Direct. U.S. Large Cap Equity = Russell 1000®TR USD; Non-U.S. Equity = MSCI EAFE NR USD; REITs = FTSE NAREIT All Equity REITs TR USD; U.S. Bonds = Bloomberg U.S. Aggregate Bond TR USD. Index returns represent past performance, are not a guarantee of future performance, and are not indicative of any specific investment. Indexes are unmanaged and cannot be invested in directly.
Further, many feel that current geopolitical events, like potential trade wars, the recent passing of the U.S. tax bill by Congress in December of 2017, and tensions in the Middle East that could disrupt oil supply globally, could create a windfall for inflation and commodity prices going forward.
Bottom line:
While the commodities asset class has struggled since the Great Financial Crisis relative to the other major asset classes, recent geopolitical events combined with a late-cycle backdrop have created a potentially rewarding technical environment for commodity returns. Further, the strategic rationale for maintaining an allocation to commodities – diversification and a potential hedge against inflation – remains as relevant as ever. For these reasons, Russell Investments believes the asset class still deserves a strategic allocation within a diversified, multi-asset portfolio.