Factor investing and U.S. recessions: How have key equity factors performed on a historical basis?
Executive summary:
- In the five months prior to U.S. recessions dating to the 1920s, the equity Momentum factor was the top performer, with an annualized cumulative excess market return of +6.7%, on average.
- The equity Investment, Quality and Profitability factors have historically performed the best during U.S. recessions.
- In the 12 months following U.S. recessions since the 1920s, the equity Size and Value factors have performed the best.
In the 96 years spanning 1927 to 2022, there were 16 recessions totaling 199 months (16.6 years), with average loss of -2.4% annualized. The stock market often anticipates recessions—but how soon before a recession? Our analysis shows that the market peaks on average five months before a recession. Below we examine how different equity factors have performed during past recessions—and what happened before and after those events. Note that factor returns are calculated as long-short returns.
Factor performance prior to recessions: Momentum comes in first
During the five months prior to recessions (Figure 1), annualized cumulative excess market return versus risk free rate was -1.2% on average. Momentum (MOM) was the strongest performer (+6.7% on average with 80% hit rate), and Size (SMB, small minus big), Value (HML, high minus low) and Investment (CMA, conservative minus aggressive), were the weakest performers (-1.1%, 0.3%, and 0.6% on average, respectively) during the same period.
Figure 1: Cumulative performance before recessions (5 months prior)
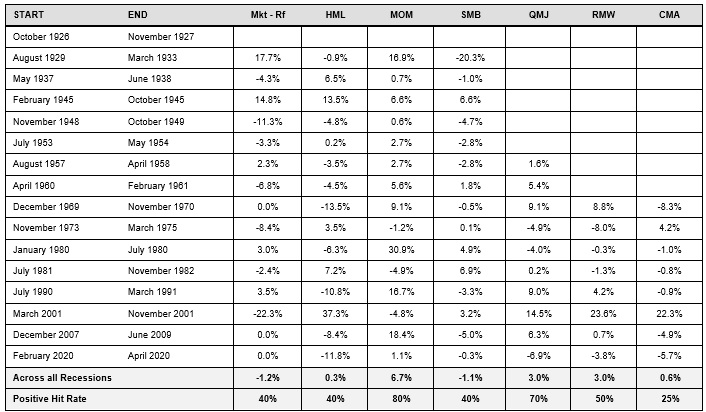
Legend
HML: Value (High minus low)
MOM: Momentum
SMB: Size (Small minus big)
QMJ: Quality (Quality minus junk)
RMW: Profitability (Robust minus weak)
CMA: Investment (Conservative minus aggressive)
Source: Kenneth French website, AQR
Factor performance during recessions: Investment, Quality and Profitability lead the pack
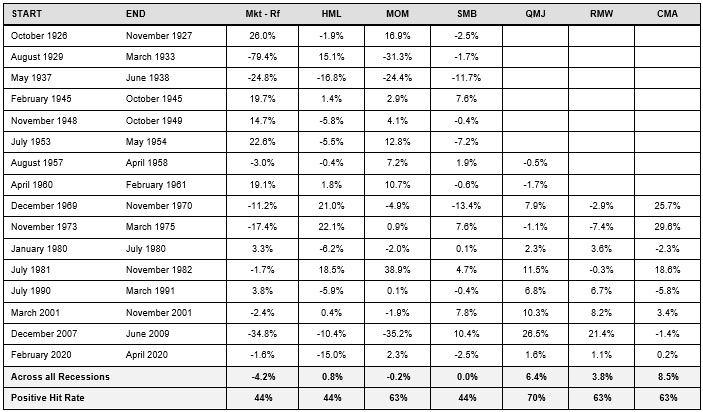
During recessions (Figure 2), annualized cumulative excess market return versus risk free rate was -4.2% on average. Investment (CMA, conservative minus aggressive), Quality (QMJ, quality minus junk) and Profitability (RMW, robust minus weak) factors were the best performers (+8.5%, +6.4% and +3.8% on average, respectively). Value (HML, high minus low), Momentum (MOM) and Size (SMB, small minus big) were flat during recessions.
Figure 2: Cumulative performance during recessions
Source: Kenneth French website, AQR
Factor performance after recessions: 27% on average
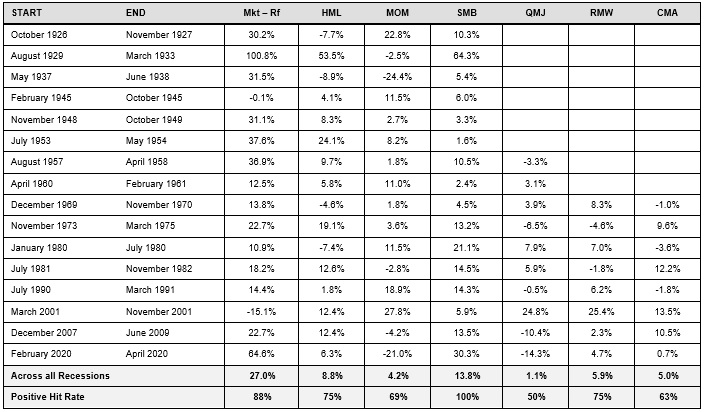
In the 12 months following each recession (Figure 3), the annualized cumulative market risk premium was 27% on average. Size was the best performer (+13.8% on average with a positive hit rate of 100%), followed by value (+8.8% on average with a positive hit rate of 75%). Quality performed the worst one year after recessions (only +1.1% on average with a positive hit rate of 50%).
Figure 3: Cumulative performance after recessions (12 months after)
Source: Kenneth French website, AQR
How did different factors perform during recessions with negative U.S. equity returns? What about positive returns?
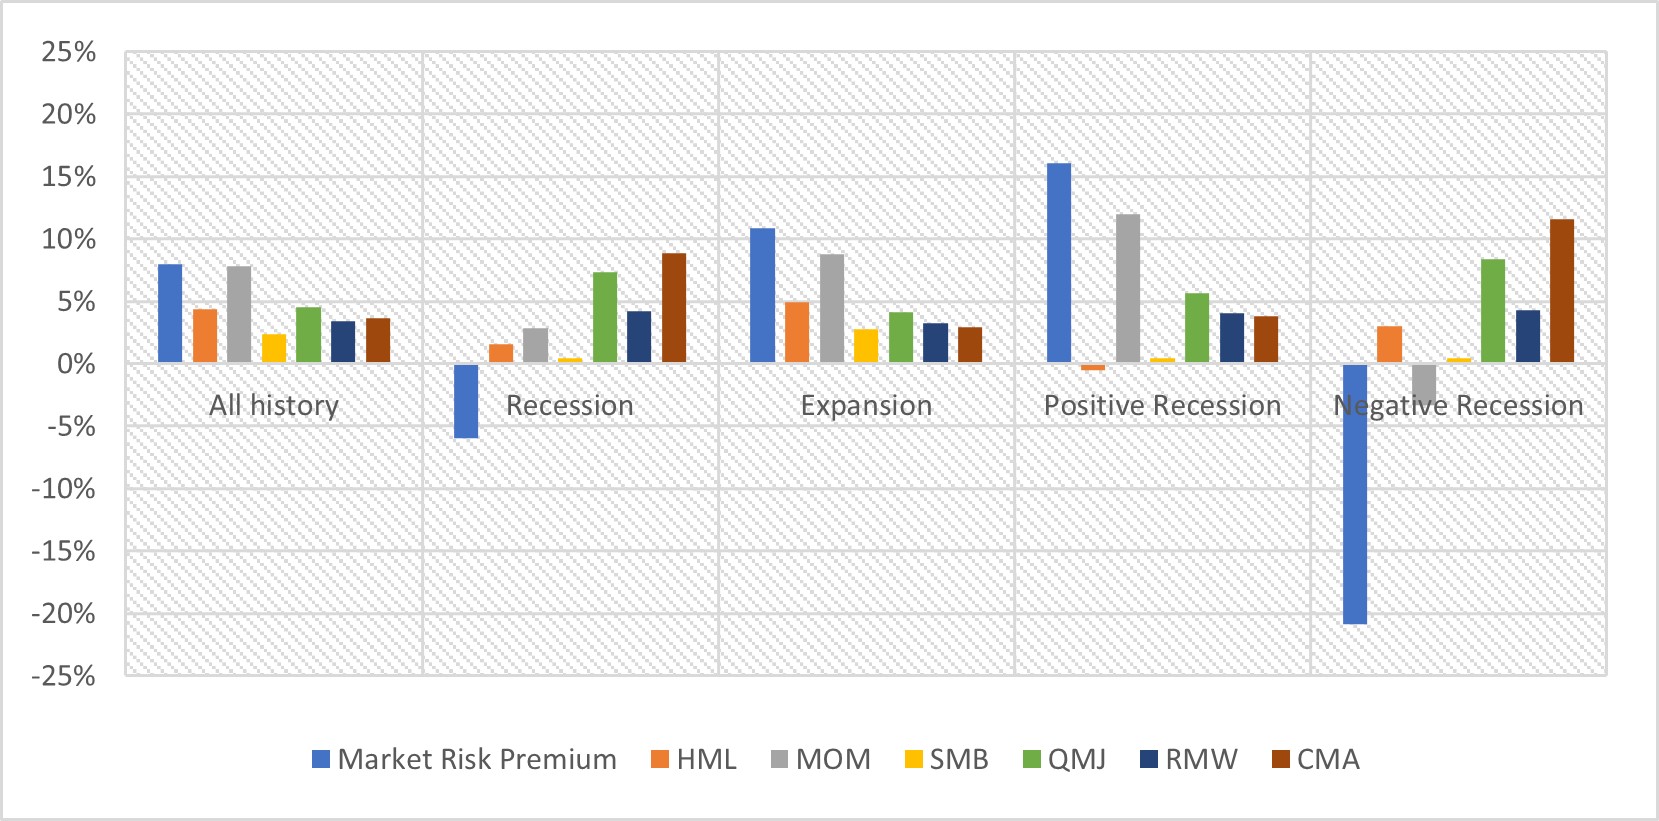
During eight of the 16 recessions (Figure 4), U.S. equity returns were negative with an average annualized return of -18.1% over 119 months (9.9 years). During another eight of the 16 recessions, U.S. equity returns were positive with an average annualized return of 20.8% over 80 months (6.7 years). The expansion phases lasted for 953 months (79.4 years), and the U.S. market returned 14% on average during expansions.
Investment, quality and profitability performed well in both positive and negative recessions with higher performance in negative recessions. Size didn’t perform well in both positive and negative recessions. Value performed better in negative recessions while momentum demonstrated very strong performance in positive recessions and negative performance in negative recessions. During expansion phases, momentum was the strongest performer while size was the weakest performer.
Figure 4: Arithmetic average returns (1927-2022)
Source: Kenneth French website, AQR
Factor performance during positive and negative market performance years
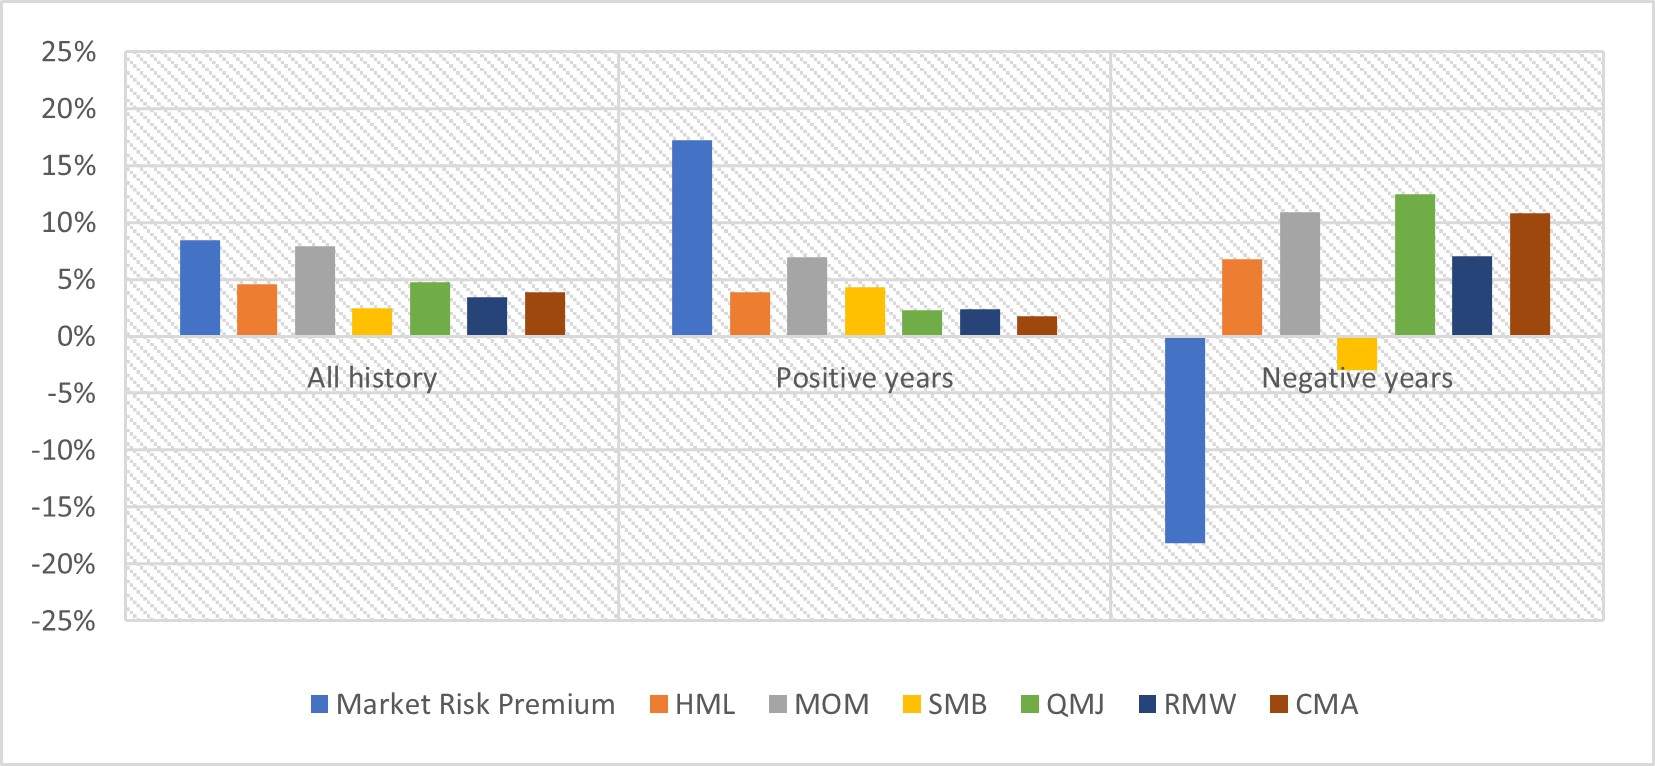
Finally, we analyzed positive and negative market performance years instead of recessions (Figure 5). Since 1927, U.S. stock returns were positive in 72 years, with an average market risk premium return of 17.3%. U.S. stock returns were negative in 24 years, with market risk premium averaging -18.2%. In negative years, size was the worst performer (-3.0%) while quality was the best performer (+10.7%). In positive years, investment was the worst performer (+1.7%) while momentum was the best performer (+7.0%).
Figure 5: Arithmetic average returns (1927-2022)
Source: Kenneth French website, AQR
The bottom line
This analysis demonstrates the cyclicality of different equity factors and highlights the importance of diversification. Our factor completion portfolios can ensure exposures to factor risks in the total portfolio are balanced and aligned with targets. These completion portfolios are designed to precisely align our clients’ portfolios with their investment beliefs and then dynamically maintain that precision and risk control throughout turbulent, fast-moving market cycles, including recessions.